Immigrants from Europe vs Immigrants from Costa Rica In Labor Force | Age 45-54
COMPARE
Immigrants from Europe
Immigrants from Costa Rica
In Labor Force | Age 45-54
In Labor Force | Age 45-54 Comparison
Immigrants from Europe
Immigrants from Costa Rica
83.2%
IN LABOR FORCE | AGE 45-54
90.7/ 100
METRIC RATING
118th/ 347
METRIC RANK
82.6%
IN LABOR FORCE | AGE 45-54
28.3/ 100
METRIC RATING
187th/ 347
METRIC RANK
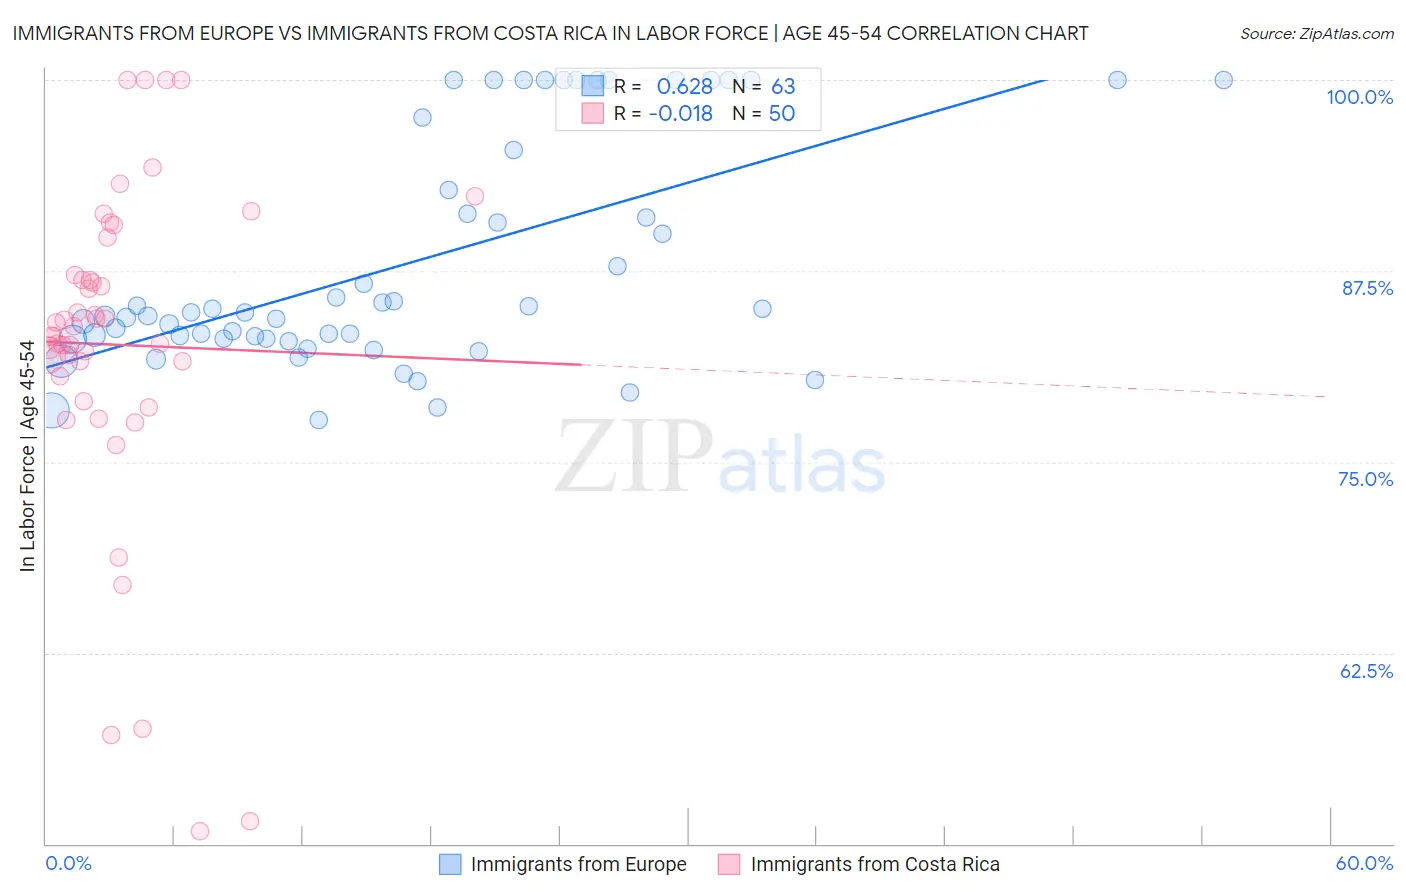
Immigrants from Europe vs Immigrants from Costa Rica In Labor Force | Age 45-54 Correlation Chart
The statistical analysis conducted on geographies consisting of 546,802,439 people shows a significant positive correlation between the proportion of Immigrants from Europe and labor force participation rate among population between the ages 45 and 54 in the United States with a correlation coefficient (R) of 0.628 and weighted average of 83.2%. Similarly, the statistical analysis conducted on geographies consisting of 204,239,151 people shows no correlation between the proportion of Immigrants from Costa Rica and labor force participation rate among population between the ages 45 and 54 in the United States with a correlation coefficient (R) of -0.018 and weighted average of 82.6%, a difference of 0.71%.
In Labor Force | Age 45-54 Correlation Summary
| Measurement | Immigrants from Europe | Immigrants from Costa Rica |
| Minimum | 77.7% | 50.8% |
| Maximum | 100.0% | 100.0% |
| Range | 22.3% | 49.2% |
| Mean | 88.0% | 82.7% |
| Median | 84.7% | 83.5% |
| Interquartile 25% (IQ1) | 83.1% | 80.6% |
| Interquartile 75% (IQ3) | 95.5% | 87.2% |
| Interquartile Range (IQR) | 12.4% | 6.6% |
| Standard Deviation (Sample) | 7.4% | 10.9% |
| Standard Deviation (Population) | 7.3% | 10.8% |
Similar Demographics by In Labor Force | Age 45-54
Demographics Similar to Immigrants from Europe by In Labor Force | Age 45-54
In terms of in labor force | age 45-54, the demographic groups most similar to Immigrants from Europe are Immigrants from China (83.2%, a difference of 0.010%), Immigrants from Uruguay (83.2%, a difference of 0.010%), Immigrants from Russia (83.2%, a difference of 0.010%), Immigrants from Chile (83.2%, a difference of 0.020%), and Immigrants from Malaysia (83.2%, a difference of 0.020%).
| Demographics | Rating | Rank | In Labor Force | Age 45-54 |
| Immigrants | Italy | 92.5 /100 | #111 | Exceptional 83.2% |
| Immigrants | Afghanistan | 92.4 /100 | #112 | Exceptional 83.2% |
| Immigrants | Albania | 91.8 /100 | #113 | Exceptional 83.2% |
| Assyrians/Chaldeans/Syriacs | 91.7 /100 | #114 | Exceptional 83.2% |
| Immigrants | Chile | 91.6 /100 | #115 | Exceptional 83.2% |
| Immigrants | Malaysia | 91.4 /100 | #116 | Exceptional 83.2% |
| Immigrants | China | 90.9 /100 | #117 | Exceptional 83.2% |
| Immigrants | Europe | 90.7 /100 | #118 | Exceptional 83.2% |
| Immigrants | Uruguay | 90.2 /100 | #119 | Exceptional 83.2% |
| Immigrants | Russia | 90.1 /100 | #120 | Exceptional 83.2% |
| Uruguayans | 89.4 /100 | #121 | Excellent 83.1% |
| Immigrants | Vietnam | 88.9 /100 | #122 | Excellent 83.1% |
| Tongans | 88.2 /100 | #123 | Excellent 83.1% |
| Bermudans | 88.0 /100 | #124 | Excellent 83.1% |
| Immigrants | Iran | 87.2 /100 | #125 | Excellent 83.1% |
Demographics Similar to Immigrants from Costa Rica by In Labor Force | Age 45-54
In terms of in labor force | age 45-54, the demographic groups most similar to Immigrants from Costa Rica are South African (82.6%, a difference of 0.0%), Irish (82.6%, a difference of 0.010%), Syrian (82.6%, a difference of 0.030%), British (82.6%, a difference of 0.030%), and Immigrants from England (82.6%, a difference of 0.040%).
| Demographics | Rating | Rank | In Labor Force | Age 45-54 |
| Hungarians | 38.0 /100 | #180 | Fair 82.7% |
| Israelis | 37.7 /100 | #181 | Fair 82.7% |
| Immigrants | Hungary | 37.1 /100 | #182 | Fair 82.7% |
| New Zealanders | 32.7 /100 | #183 | Fair 82.6% |
| Europeans | 32.6 /100 | #184 | Fair 82.6% |
| Immigrants | England | 32.2 /100 | #185 | Fair 82.6% |
| Irish | 29.2 /100 | #186 | Fair 82.6% |
| Immigrants | Costa Rica | 28.3 /100 | #187 | Fair 82.6% |
| South Africans | 28.0 /100 | #188 | Fair 82.6% |
| Syrians | 26.0 /100 | #189 | Fair 82.6% |
| British | 25.7 /100 | #190 | Fair 82.6% |
| Armenians | 23.2 /100 | #191 | Fair 82.5% |
| Immigrants | Iraq | 20.9 /100 | #192 | Fair 82.5% |
| Australians | 20.8 /100 | #193 | Fair 82.5% |
| Immigrants | Norway | 20.7 /100 | #194 | Fair 82.5% |