Immigrants from Europe vs Immigrants from Guyana Child Poverty Among Girls Under 16
COMPARE
Immigrants from Europe
Immigrants from Guyana
Child Poverty Among Girls Under 16
Child Poverty Among Girls Under 16 Comparison
Immigrants from Europe
Immigrants from Guyana
14.4%
CHILD POVERTY AMONG GIRLS UNDER 16
98.7/ 100
METRIC RATING
63rd/ 347
METRIC RANK
19.3%
CHILD POVERTY AMONG GIRLS UNDER 16
0.3/ 100
METRIC RATING
253rd/ 347
METRIC RANK
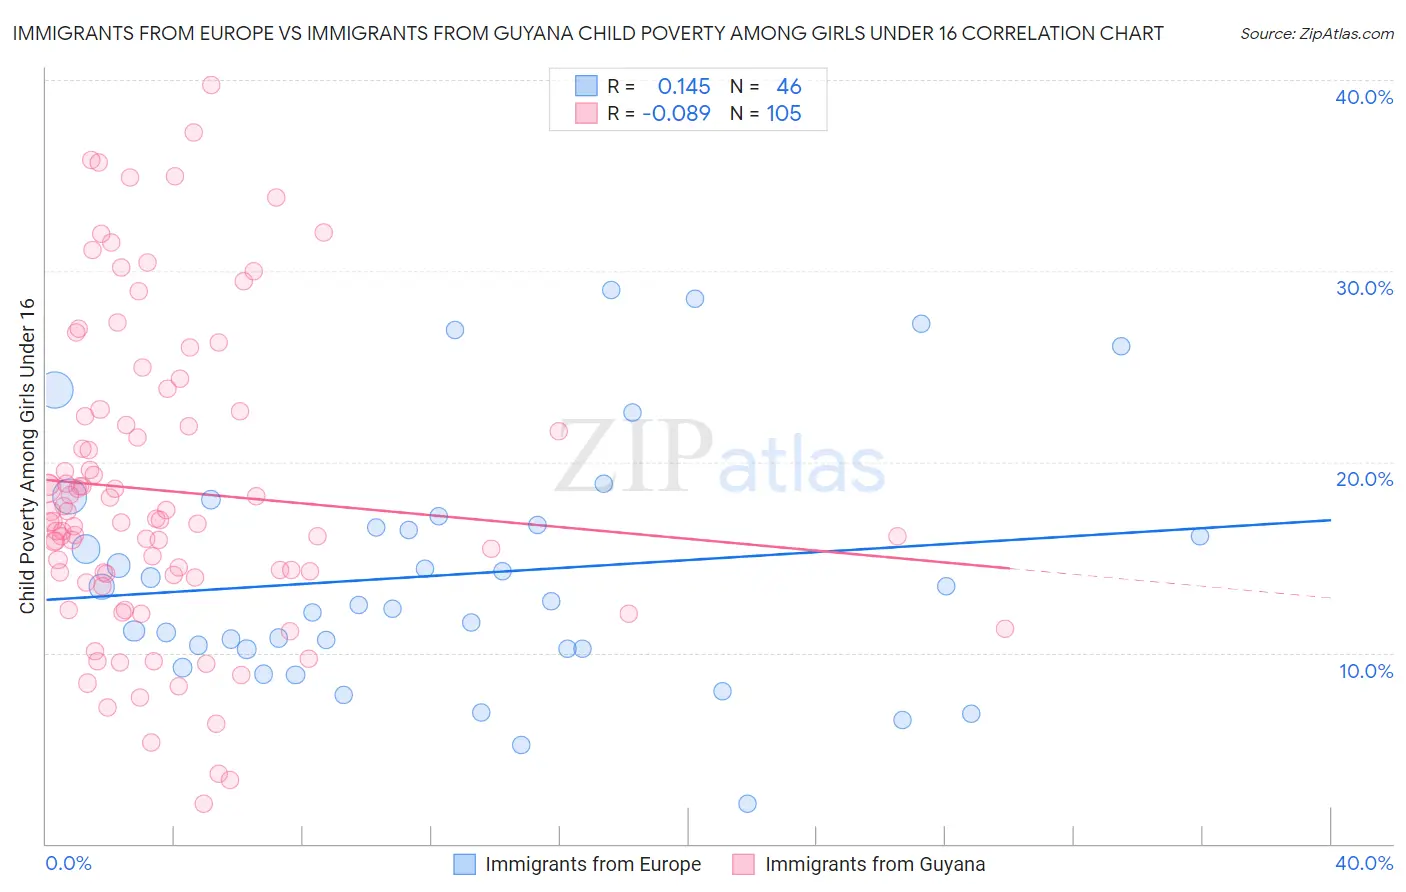
Immigrants from Europe vs Immigrants from Guyana Child Poverty Among Girls Under 16 Correlation Chart
The statistical analysis conducted on geographies consisting of 528,272,896 people shows a poor positive correlation between the proportion of Immigrants from Europe and poverty level among girls under the age of 16 in the United States with a correlation coefficient (R) of 0.145 and weighted average of 14.4%. Similarly, the statistical analysis conducted on geographies consisting of 181,781,913 people shows a slight negative correlation between the proportion of Immigrants from Guyana and poverty level among girls under the age of 16 in the United States with a correlation coefficient (R) of -0.089 and weighted average of 19.3%, a difference of 33.6%.
Child Poverty Among Girls Under 16 Correlation Summary
| Measurement | Immigrants from Europe | Immigrants from Guyana |
| Minimum | 2.1% | 2.1% |
| Maximum | 29.0% | 39.8% |
| Range | 26.9% | 37.6% |
| Mean | 14.1% | 18.5% |
| Median | 12.6% | 16.9% |
| Interquartile 25% (IQ1) | 10.2% | 14.0% |
| Interquartile 75% (IQ3) | 16.7% | 22.5% |
| Interquartile Range (IQR) | 6.5% | 8.5% |
| Standard Deviation (Sample) | 6.4% | 8.1% |
| Standard Deviation (Population) | 6.3% | 8.0% |
Similar Demographics by Child Poverty Among Girls Under 16
Demographics Similar to Immigrants from Europe by Child Poverty Among Girls Under 16
In terms of child poverty among girls under 16, the demographic groups most similar to Immigrants from Europe are Scandinavian (14.4%, a difference of 0.050%), Immigrants from Philippines (14.4%, a difference of 0.11%), Immigrants from Sweden (14.5%, a difference of 0.14%), Polish (14.4%, a difference of 0.16%), and Cambodian (14.4%, a difference of 0.16%).
| Demographics | Rating | Rank | Child Poverty Among Girls Under 16 |
| Immigrants | Indonesia | 98.9 /100 | #56 | Exceptional 14.4% |
| Immigrants | Serbia | 98.9 /100 | #57 | Exceptional 14.4% |
| Immigrants | Bulgaria | 98.8 /100 | #58 | Exceptional 14.4% |
| Zimbabweans | 98.8 /100 | #59 | Exceptional 14.4% |
| Poles | 98.7 /100 | #60 | Exceptional 14.4% |
| Cambodians | 98.7 /100 | #61 | Exceptional 14.4% |
| Scandinavians | 98.7 /100 | #62 | Exceptional 14.4% |
| Immigrants | Europe | 98.7 /100 | #63 | Exceptional 14.4% |
| Immigrants | Philippines | 98.6 /100 | #64 | Exceptional 14.4% |
| Immigrants | Sweden | 98.6 /100 | #65 | Exceptional 14.5% |
| Immigrants | Belgium | 98.5 /100 | #66 | Exceptional 14.5% |
| Laotians | 98.4 /100 | #67 | Exceptional 14.5% |
| Immigrants | Argentina | 98.3 /100 | #68 | Exceptional 14.6% |
| Immigrants | Poland | 98.2 /100 | #69 | Exceptional 14.6% |
| Europeans | 98.1 /100 | #70 | Exceptional 14.6% |
Demographics Similar to Immigrants from Guyana by Child Poverty Among Girls Under 16
In terms of child poverty among girls under 16, the demographic groups most similar to Immigrants from Guyana are Immigrants from Western Africa (19.3%, a difference of 0.060%), Immigrants from Ecuador (19.3%, a difference of 0.080%), Trinidadian and Tobagonian (19.3%, a difference of 0.15%), Immigrants from Middle Africa (19.2%, a difference of 0.20%), and Immigrants from Trinidad and Tobago (19.2%, a difference of 0.23%).
| Demographics | Rating | Rank | Child Poverty Among Girls Under 16 |
| Immigrants | Laos | 0.6 /100 | #246 | Tragic 18.9% |
| Immigrants | Ghana | 0.5 /100 | #247 | Tragic 18.9% |
| French American Indians | 0.3 /100 | #248 | Tragic 19.2% |
| Potawatomi | 0.3 /100 | #249 | Tragic 19.2% |
| Cape Verdeans | 0.3 /100 | #250 | Tragic 19.2% |
| Immigrants | Trinidad and Tobago | 0.3 /100 | #251 | Tragic 19.2% |
| Immigrants | Middle Africa | 0.3 /100 | #252 | Tragic 19.2% |
| Immigrants | Guyana | 0.3 /100 | #253 | Tragic 19.3% |
| Immigrants | Western Africa | 0.3 /100 | #254 | Tragic 19.3% |
| Immigrants | Ecuador | 0.3 /100 | #255 | Tragic 19.3% |
| Trinidadians and Tobagonians | 0.2 /100 | #256 | Tragic 19.3% |
| Guyanese | 0.2 /100 | #257 | Tragic 19.4% |
| Salvadorans | 0.2 /100 | #258 | Tragic 19.4% |
| Ottawa | 0.2 /100 | #259 | Tragic 19.4% |
| Mexican American Indians | 0.2 /100 | #260 | Tragic 19.5% |