Immigrants from Ethiopia vs Immigrants from Philippines Female Poverty Among 25-34 Year Olds
COMPARE
Immigrants from Ethiopia
Immigrants from Philippines
Female Poverty Among 25-34 Year Olds
Female Poverty Among 25-34 Year Olds Comparison
Immigrants from Ethiopia
Immigrants from Philippines
12.6%
FEMALE POVERTY AMONG 25-34 YEAR OLDS
96.5/ 100
METRIC RATING
98th/ 347
METRIC RANK
12.0%
FEMALE POVERTY AMONG 25-34 YEAR OLDS
99.5/ 100
METRIC RATING
55th/ 347
METRIC RANK
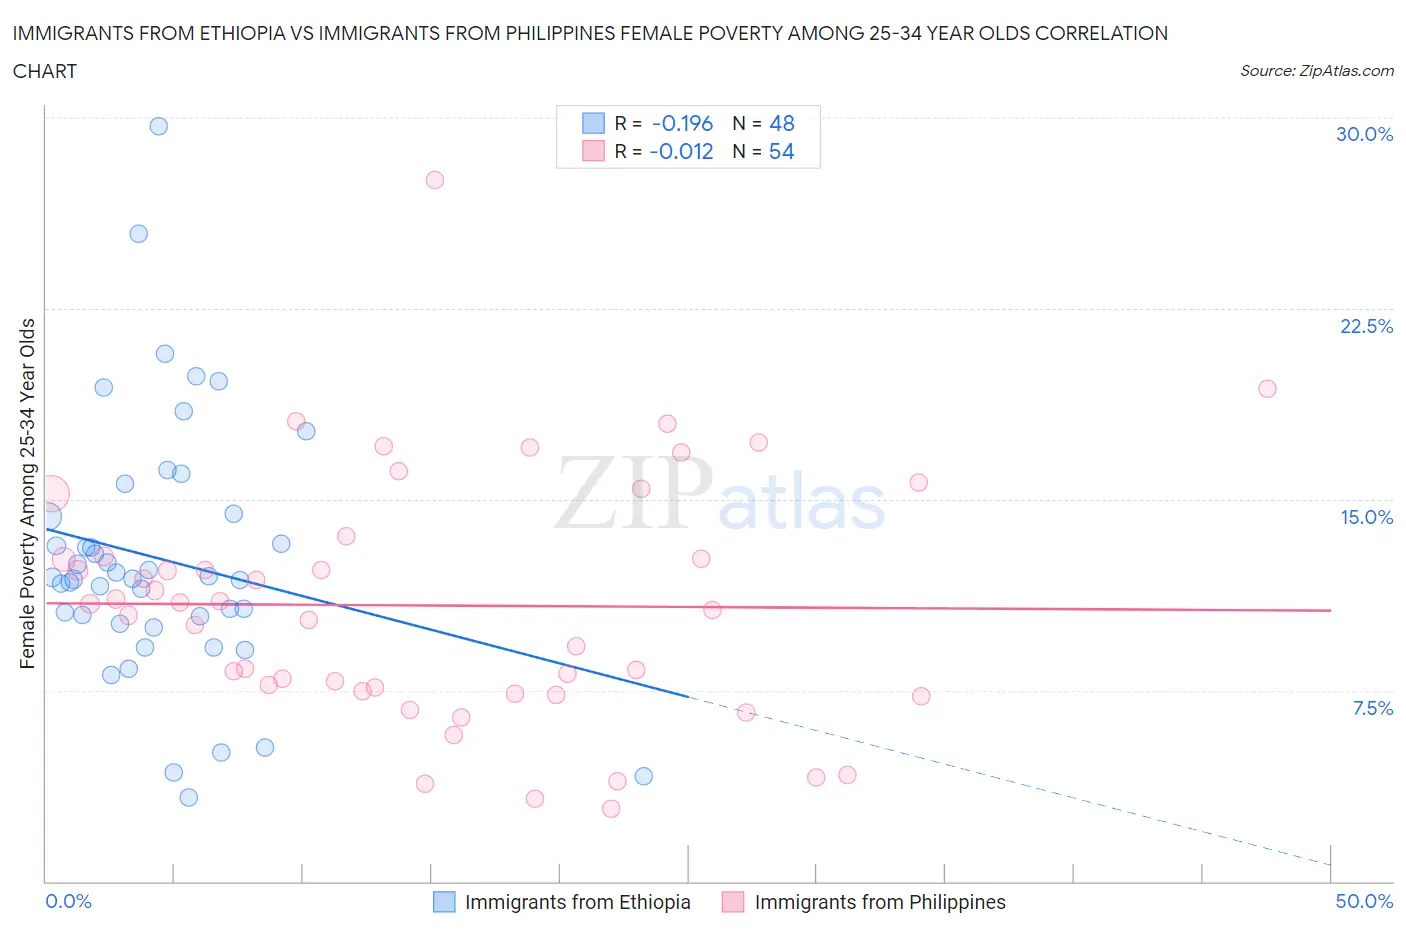
Immigrants from Ethiopia vs Immigrants from Philippines Female Poverty Among 25-34 Year Olds Correlation Chart
The statistical analysis conducted on geographies consisting of 210,146,799 people shows a poor negative correlation between the proportion of Immigrants from Ethiopia and poverty level among females between the ages 25 and 34 in the United States with a correlation coefficient (R) of -0.196 and weighted average of 12.6%. Similarly, the statistical analysis conducted on geographies consisting of 461,816,579 people shows no correlation between the proportion of Immigrants from Philippines and poverty level among females between the ages 25 and 34 in the United States with a correlation coefficient (R) of -0.012 and weighted average of 12.0%, a difference of 4.7%.
Female Poverty Among 25-34 Year Olds Correlation Summary
| Measurement | Immigrants from Ethiopia | Immigrants from Philippines |
| Minimum | 3.3% | 2.9% |
| Maximum | 29.7% | 27.5% |
| Range | 26.4% | 24.7% |
| Mean | 12.6% | 10.8% |
| Median | 11.9% | 10.8% |
| Interquartile 25% (IQ1) | 10.2% | 7.5% |
| Interquartile 75% (IQ3) | 14.4% | 12.8% |
| Interquartile Range (IQR) | 4.1% | 5.3% |
| Standard Deviation (Sample) | 5.1% | 4.8% |
| Standard Deviation (Population) | 5.1% | 4.8% |
Similar Demographics by Female Poverty Among 25-34 Year Olds
Demographics Similar to Immigrants from Ethiopia by Female Poverty Among 25-34 Year Olds
In terms of female poverty among 25-34 year olds, the demographic groups most similar to Immigrants from Ethiopia are Immigrants from Northern Africa (12.6%, a difference of 0.0%), Immigrants from Argentina (12.6%, a difference of 0.11%), Immigrants from Zimbabwe (12.6%, a difference of 0.12%), Ukrainian (12.6%, a difference of 0.13%), and Immigrants from France (12.6%, a difference of 0.17%).
| Demographics | Rating | Rank | Female Poverty Among 25-34 Year Olds |
| Norwegians | 96.9 /100 | #91 | Exceptional 12.6% |
| Immigrants | Armenia | 96.9 /100 | #92 | Exceptional 12.6% |
| Palestinians | 96.9 /100 | #93 | Exceptional 12.6% |
| Immigrants | France | 96.8 /100 | #94 | Exceptional 12.6% |
| Ukrainians | 96.7 /100 | #95 | Exceptional 12.6% |
| Immigrants | Zimbabwe | 96.7 /100 | #96 | Exceptional 12.6% |
| Immigrants | Northern Africa | 96.6 /100 | #97 | Exceptional 12.6% |
| Immigrants | Ethiopia | 96.5 /100 | #98 | Exceptional 12.6% |
| Immigrants | Argentina | 96.4 /100 | #99 | Exceptional 12.6% |
| Immigrants | Denmark | 95.7 /100 | #100 | Exceptional 12.7% |
| Immigrants | Switzerland | 95.7 /100 | #101 | Exceptional 12.7% |
| Peruvians | 95.6 /100 | #102 | Exceptional 12.7% |
| Immigrants | Spain | 95.5 /100 | #103 | Exceptional 12.7% |
| Swedes | 95.4 /100 | #104 | Exceptional 12.7% |
| Immigrants | South Africa | 95.3 /100 | #105 | Exceptional 12.7% |
Demographics Similar to Immigrants from Philippines by Female Poverty Among 25-34 Year Olds
In terms of female poverty among 25-34 year olds, the demographic groups most similar to Immigrants from Philippines are Eastern European (12.0%, a difference of 0.17%), Immigrants from Israel (12.0%, a difference of 0.29%), Luxembourger (12.1%, a difference of 0.33%), Jordanian (12.1%, a difference of 0.35%), and Immigrants from Eastern Europe (12.0%, a difference of 0.41%).
| Demographics | Rating | Rank | Female Poverty Among 25-34 Year Olds |
| Immigrants | Belarus | 99.6 /100 | #48 | Exceptional 12.0% |
| Immigrants | Egypt | 99.6 /100 | #49 | Exceptional 12.0% |
| Immigrants | Croatia | 99.6 /100 | #50 | Exceptional 12.0% |
| Paraguayans | 99.6 /100 | #51 | Exceptional 12.0% |
| Immigrants | Eastern Europe | 99.6 /100 | #52 | Exceptional 12.0% |
| Immigrants | Israel | 99.6 /100 | #53 | Exceptional 12.0% |
| Eastern Europeans | 99.6 /100 | #54 | Exceptional 12.0% |
| Immigrants | Philippines | 99.5 /100 | #55 | Exceptional 12.0% |
| Luxembourgers | 99.5 /100 | #56 | Exceptional 12.1% |
| Jordanians | 99.4 /100 | #57 | Exceptional 12.1% |
| Immigrants | Romania | 99.4 /100 | #58 | Exceptional 12.1% |
| Russians | 99.4 /100 | #59 | Exceptional 12.1% |
| Immigrants | Northern Europe | 99.4 /100 | #60 | Exceptional 12.1% |
| Immigrants | Czechoslovakia | 99.4 /100 | #61 | Exceptional 12.1% |
| Immigrants | Moldova | 99.3 /100 | #62 | Exceptional 12.1% |