Immigrants from Ethiopia vs Immigrants from Philippines Child Poverty Among Boys Under 16
COMPARE
Immigrants from Ethiopia
Immigrants from Philippines
Child Poverty Among Boys Under 16
Child Poverty Among Boys Under 16 Comparison
Immigrants from Ethiopia
Immigrants from Philippines
16.4%
CHILD POVERTY AMONG BOYS UNDER 16
51.3/ 100
METRIC RATING
171st/ 347
METRIC RANK
14.3%
CHILD POVERTY AMONG BOYS UNDER 16
99.0/ 100
METRIC RATING
53rd/ 347
METRIC RANK
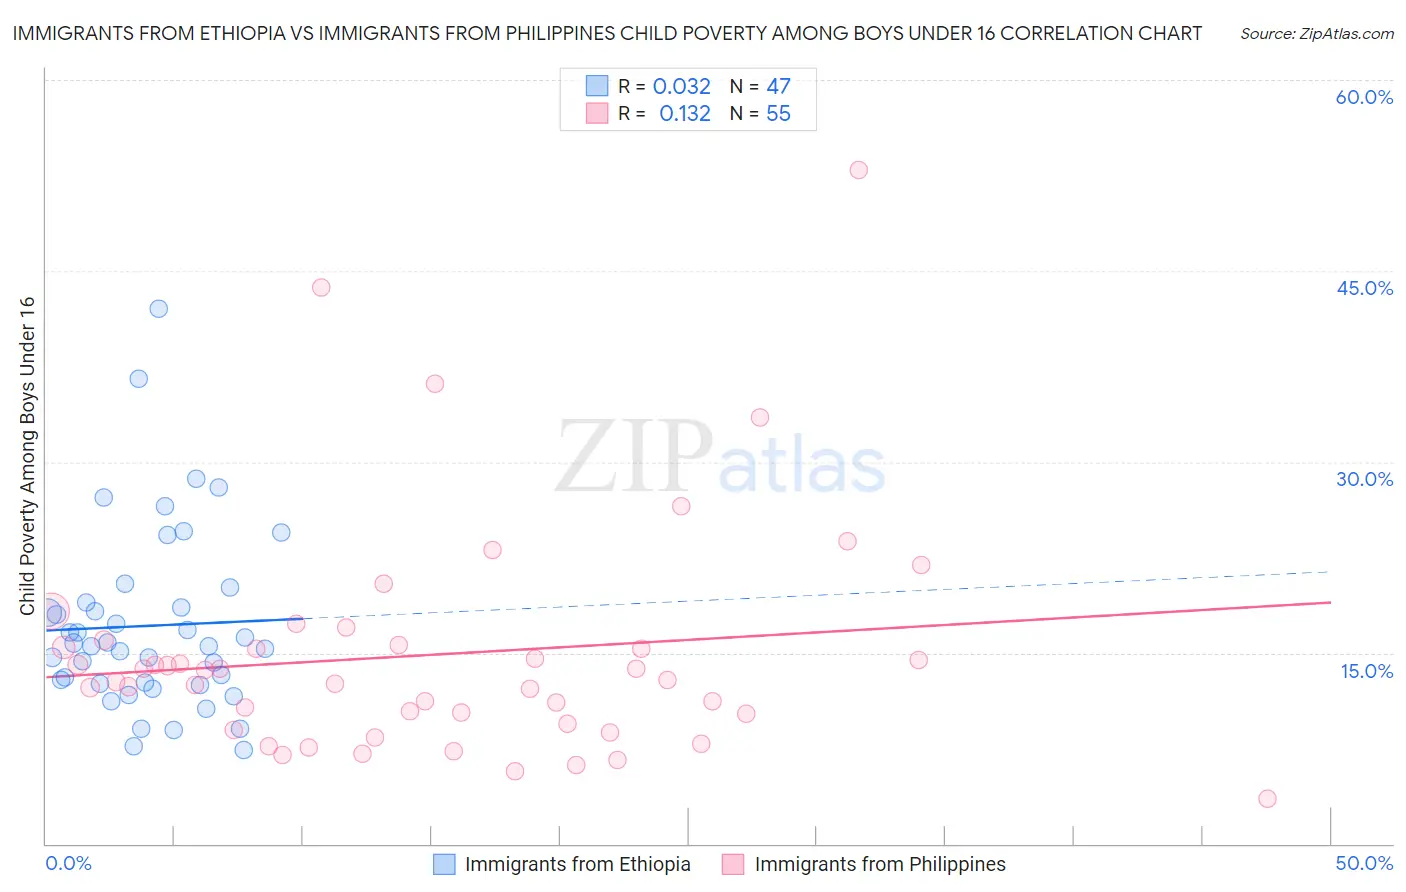
Immigrants from Ethiopia vs Immigrants from Philippines Child Poverty Among Boys Under 16 Correlation Chart
The statistical analysis conducted on geographies consisting of 210,013,422 people shows no correlation between the proportion of Immigrants from Ethiopia and poverty level among boys under the age of 16 in the United States with a correlation coefficient (R) of 0.032 and weighted average of 16.4%. Similarly, the statistical analysis conducted on geographies consisting of 461,906,754 people shows a poor positive correlation between the proportion of Immigrants from Philippines and poverty level among boys under the age of 16 in the United States with a correlation coefficient (R) of 0.132 and weighted average of 14.3%, a difference of 14.5%.
Child Poverty Among Boys Under 16 Correlation Summary
| Measurement | Immigrants from Ethiopia | Immigrants from Philippines |
| Minimum | 7.4% | 3.6% |
| Maximum | 42.0% | 52.9% |
| Range | 34.6% | 49.4% |
| Mean | 17.1% | 14.9% |
| Median | 15.5% | 12.9% |
| Interquartile 25% (IQ1) | 12.5% | 9.5% |
| Interquartile 75% (IQ3) | 18.9% | 15.7% |
| Interquartile Range (IQR) | 6.4% | 6.2% |
| Standard Deviation (Sample) | 7.1% | 9.1% |
| Standard Deviation (Population) | 7.0% | 9.0% |
Similar Demographics by Child Poverty Among Boys Under 16
Demographics Similar to Immigrants from Ethiopia by Child Poverty Among Boys Under 16
In terms of child poverty among boys under 16, the demographic groups most similar to Immigrants from Ethiopia are Immigrants from Bosnia and Herzegovina (16.4%, a difference of 0.050%), Immigrants from Colombia (16.4%, a difference of 0.050%), Tsimshian (16.4%, a difference of 0.080%), Uruguayan (16.4%, a difference of 0.14%), and Immigrants from Syria (16.5%, a difference of 0.25%).
| Demographics | Rating | Rank | Child Poverty Among Boys Under 16 |
| Immigrants | Albania | 67.9 /100 | #164 | Good 16.1% |
| Colombians | 65.2 /100 | #165 | Good 16.1% |
| Immigrants | Germany | 63.6 /100 | #166 | Good 16.2% |
| Afghans | 55.4 /100 | #167 | Average 16.3% |
| South Americans | 55.3 /100 | #168 | Average 16.3% |
| Immigrants | Saudi Arabia | 53.6 /100 | #169 | Average 16.4% |
| Immigrants | Bosnia and Herzegovina | 51.7 /100 | #170 | Average 16.4% |
| Immigrants | Ethiopia | 51.3 /100 | #171 | Average 16.4% |
| Immigrants | Colombia | 50.8 /100 | #172 | Average 16.4% |
| Tsimshian | 50.5 /100 | #173 | Average 16.4% |
| Uruguayans | 50.0 /100 | #174 | Average 16.4% |
| Immigrants | Syria | 49.0 /100 | #175 | Average 16.5% |
| Whites/Caucasians | 48.2 /100 | #176 | Average 16.5% |
| Ethiopians | 47.8 /100 | #177 | Average 16.5% |
| Scotch-Irish | 47.5 /100 | #178 | Average 16.5% |
Demographics Similar to Immigrants from Philippines by Child Poverty Among Boys Under 16
In terms of child poverty among boys under 16, the demographic groups most similar to Immigrants from Philippines are Laotian (14.3%, a difference of 0.040%), Immigrants from Serbia (14.3%, a difference of 0.080%), Immigrants from Pakistan (14.3%, a difference of 0.13%), Zimbabwean (14.3%, a difference of 0.13%), and Polish (14.4%, a difference of 0.24%).
| Demographics | Rating | Rank | Child Poverty Among Boys Under 16 |
| Greeks | 99.4 /100 | #46 | Exceptional 14.1% |
| Immigrants | Moldova | 99.4 /100 | #47 | Exceptional 14.1% |
| Immigrants | Indonesia | 99.4 /100 | #48 | Exceptional 14.1% |
| Czechs | 99.3 /100 | #49 | Exceptional 14.1% |
| Italians | 99.2 /100 | #50 | Exceptional 14.2% |
| Immigrants | Greece | 99.2 /100 | #51 | Exceptional 14.2% |
| Laotians | 99.0 /100 | #52 | Exceptional 14.3% |
| Immigrants | Philippines | 99.0 /100 | #53 | Exceptional 14.3% |
| Immigrants | Serbia | 99.0 /100 | #54 | Exceptional 14.3% |
| Immigrants | Pakistan | 99.0 /100 | #55 | Exceptional 14.3% |
| Zimbabweans | 99.0 /100 | #56 | Exceptional 14.3% |
| Poles | 98.9 /100 | #57 | Exceptional 14.4% |
| Immigrants | Sweden | 98.9 /100 | #58 | Exceptional 14.4% |
| Immigrants | Czechoslovakia | 98.9 /100 | #59 | Exceptional 14.4% |
| Immigrants | Belgium | 98.9 /100 | #60 | Exceptional 14.4% |