Hopi vs Immigrants from Philippines Female Poverty Among 25-34 Year Olds
COMPARE
Hopi
Immigrants from Philippines
Female Poverty Among 25-34 Year Olds
Female Poverty Among 25-34 Year Olds Comparison
Hopi
Immigrants from Philippines
23.7%
FEMALE POVERTY AMONG 25-34 YEAR OLDS
0.0/ 100
METRIC RATING
342nd/ 347
METRIC RANK
12.0%
FEMALE POVERTY AMONG 25-34 YEAR OLDS
99.5/ 100
METRIC RATING
55th/ 347
METRIC RANK
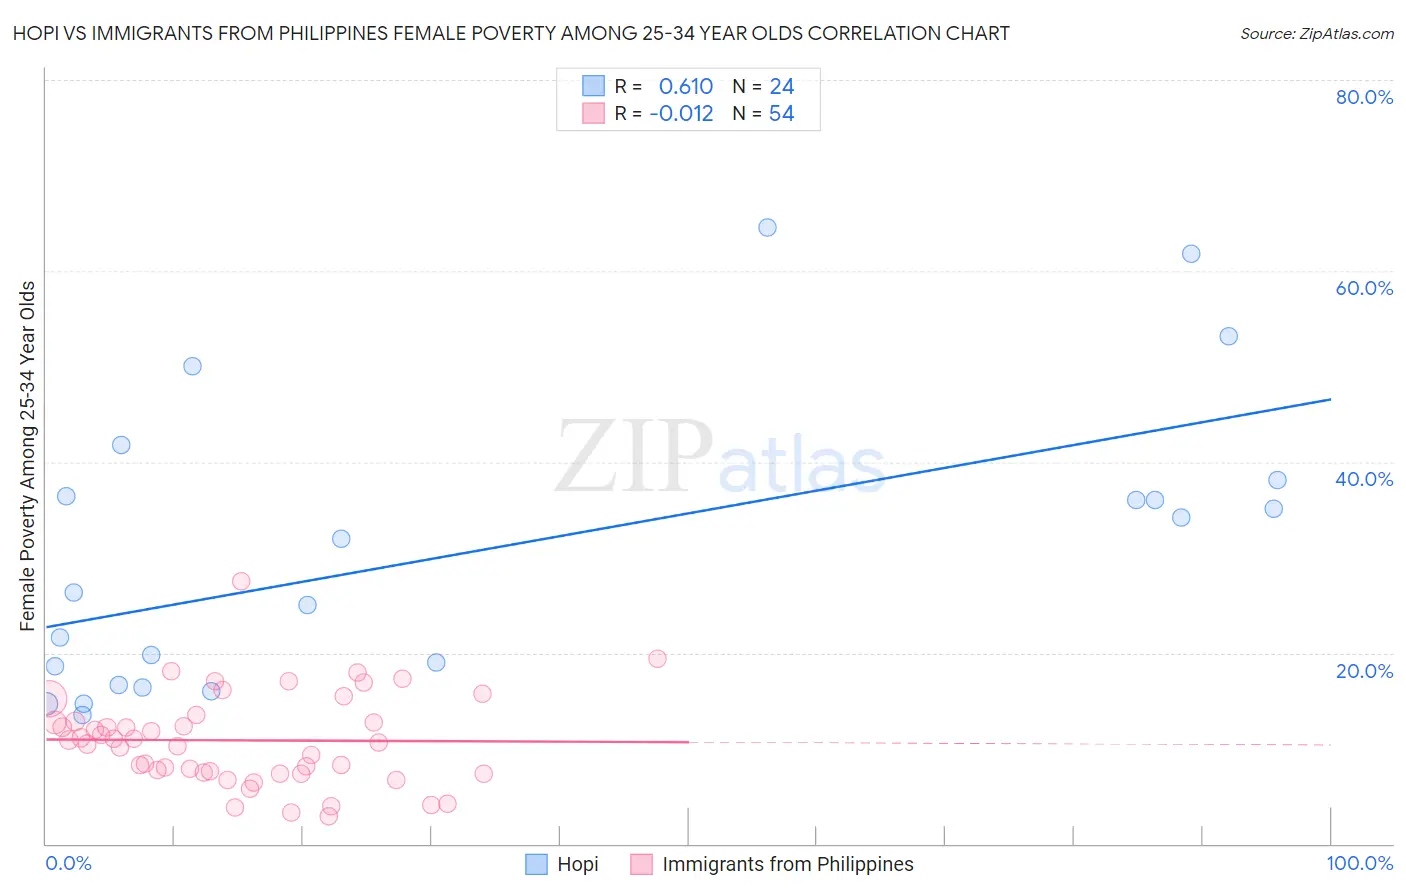
Hopi vs Immigrants from Philippines Female Poverty Among 25-34 Year Olds Correlation Chart
The statistical analysis conducted on geographies consisting of 74,551,308 people shows a significant positive correlation between the proportion of Hopi and poverty level among females between the ages 25 and 34 in the United States with a correlation coefficient (R) of 0.610 and weighted average of 23.7%. Similarly, the statistical analysis conducted on geographies consisting of 461,816,579 people shows no correlation between the proportion of Immigrants from Philippines and poverty level among females between the ages 25 and 34 in the United States with a correlation coefficient (R) of -0.012 and weighted average of 12.0%, a difference of 96.8%.
Female Poverty Among 25-34 Year Olds Correlation Summary
| Measurement | Hopi | Immigrants from Philippines |
| Minimum | 13.5% | 2.9% |
| Maximum | 64.6% | 27.5% |
| Range | 51.1% | 24.7% |
| Mean | 30.9% | 10.8% |
| Median | 29.1% | 10.8% |
| Interquartile 25% (IQ1) | 17.6% | 7.5% |
| Interquartile 75% (IQ3) | 37.3% | 12.8% |
| Interquartile Range (IQR) | 19.6% | 5.3% |
| Standard Deviation (Sample) | 15.1% | 4.8% |
| Standard Deviation (Population) | 14.8% | 4.8% |
Similar Demographics by Female Poverty Among 25-34 Year Olds
Demographics Similar to Hopi by Female Poverty Among 25-34 Year Olds
In terms of female poverty among 25-34 year olds, the demographic groups most similar to Hopi are Navajo (23.3%, a difference of 1.4%), Yup'ik (24.3%, a difference of 2.7%), Sioux (23.0%, a difference of 3.1%), Yuman (22.9%, a difference of 3.3%), and Houma (22.7%, a difference of 4.2%).
| Demographics | Rating | Rank | Female Poverty Among 25-34 Year Olds |
| Cajuns | 0.0 /100 | #333 | Tragic 19.9% |
| Apache | 0.0 /100 | #334 | Tragic 20.1% |
| Natives/Alaskans | 0.0 /100 | #335 | Tragic 20.3% |
| Pueblo | 0.0 /100 | #336 | Tragic 22.2% |
| Crow | 0.0 /100 | #337 | Tragic 22.7% |
| Houma | 0.0 /100 | #338 | Tragic 22.7% |
| Yuman | 0.0 /100 | #339 | Tragic 22.9% |
| Sioux | 0.0 /100 | #340 | Tragic 23.0% |
| Navajo | 0.0 /100 | #341 | Tragic 23.3% |
| Hopi | 0.0 /100 | #342 | Tragic 23.7% |
| Yup'ik | 0.0 /100 | #343 | Tragic 24.3% |
| Tohono O'odham | 0.0 /100 | #344 | Tragic 24.7% |
| Pima | 0.0 /100 | #345 | Tragic 25.3% |
| Lumbee | 0.0 /100 | #346 | Tragic 26.3% |
| Puerto Ricans | 0.0 /100 | #347 | Tragic 26.3% |
Demographics Similar to Immigrants from Philippines by Female Poverty Among 25-34 Year Olds
In terms of female poverty among 25-34 year olds, the demographic groups most similar to Immigrants from Philippines are Eastern European (12.0%, a difference of 0.17%), Immigrants from Israel (12.0%, a difference of 0.29%), Luxembourger (12.1%, a difference of 0.33%), Jordanian (12.1%, a difference of 0.35%), and Immigrants from Eastern Europe (12.0%, a difference of 0.41%).
| Demographics | Rating | Rank | Female Poverty Among 25-34 Year Olds |
| Immigrants | Belarus | 99.6 /100 | #48 | Exceptional 12.0% |
| Immigrants | Egypt | 99.6 /100 | #49 | Exceptional 12.0% |
| Immigrants | Croatia | 99.6 /100 | #50 | Exceptional 12.0% |
| Paraguayans | 99.6 /100 | #51 | Exceptional 12.0% |
| Immigrants | Eastern Europe | 99.6 /100 | #52 | Exceptional 12.0% |
| Immigrants | Israel | 99.6 /100 | #53 | Exceptional 12.0% |
| Eastern Europeans | 99.6 /100 | #54 | Exceptional 12.0% |
| Immigrants | Philippines | 99.5 /100 | #55 | Exceptional 12.0% |
| Luxembourgers | 99.5 /100 | #56 | Exceptional 12.1% |
| Jordanians | 99.4 /100 | #57 | Exceptional 12.1% |
| Immigrants | Romania | 99.4 /100 | #58 | Exceptional 12.1% |
| Russians | 99.4 /100 | #59 | Exceptional 12.1% |
| Immigrants | Northern Europe | 99.4 /100 | #60 | Exceptional 12.1% |
| Immigrants | Czechoslovakia | 99.4 /100 | #61 | Exceptional 12.1% |
| Immigrants | Moldova | 99.3 /100 | #62 | Exceptional 12.1% |