Cape Verdean vs Immigrants from Philippines Child Poverty Among Boys Under 16
COMPARE
Cape Verdean
Immigrants from Philippines
Child Poverty Among Boys Under 16
Child Poverty Among Boys Under 16 Comparison
Cape Verdeans
Immigrants from Philippines
18.7%
CHILD POVERTY AMONG BOYS UNDER 16
0.7/ 100
METRIC RATING
239th/ 347
METRIC RANK
14.3%
CHILD POVERTY AMONG BOYS UNDER 16
99.0/ 100
METRIC RATING
53rd/ 347
METRIC RANK
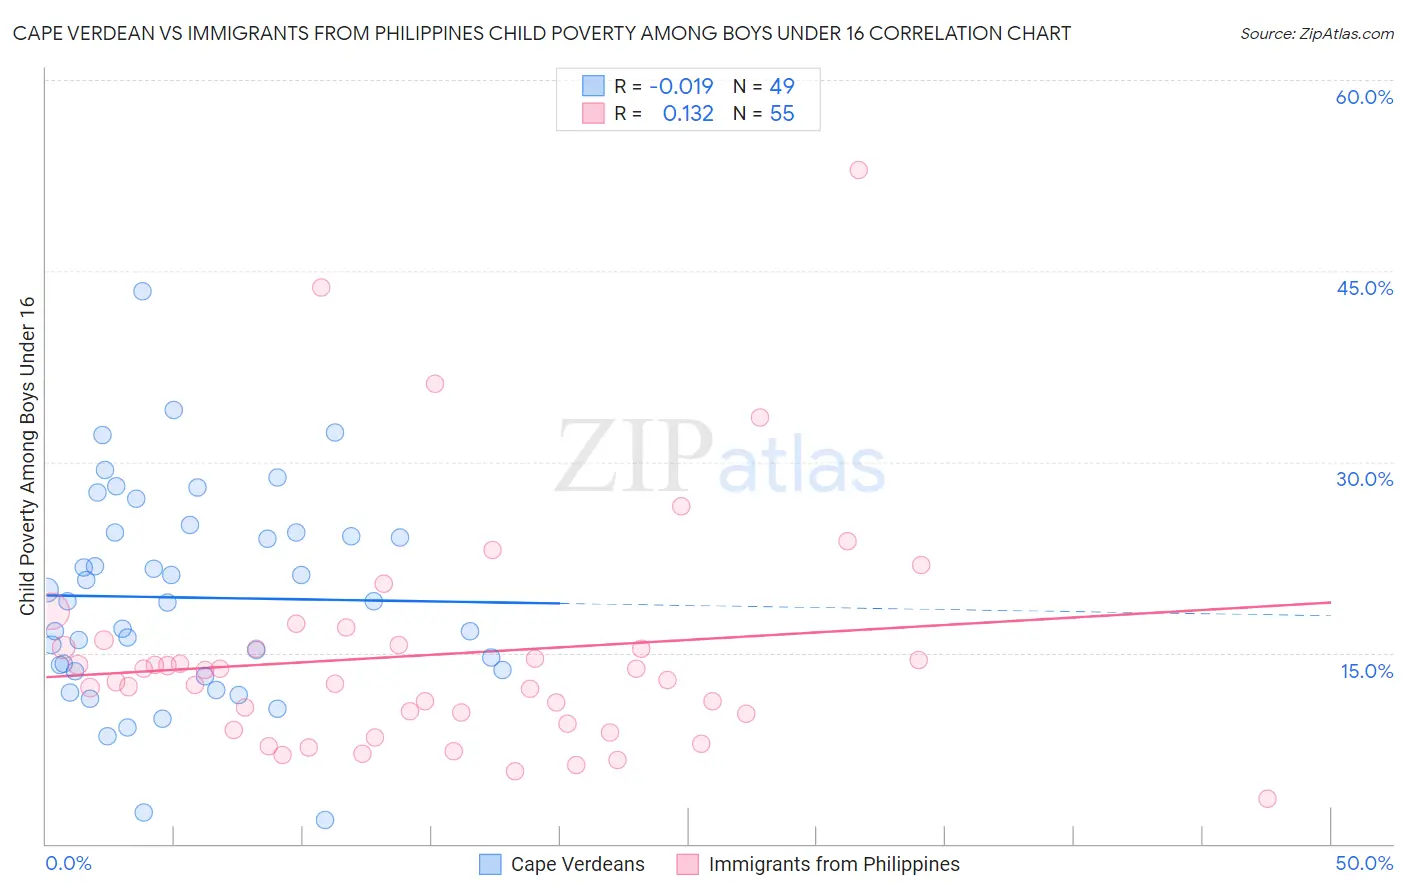
Cape Verdean vs Immigrants from Philippines Child Poverty Among Boys Under 16 Correlation Chart
The statistical analysis conducted on geographies consisting of 106,786,125 people shows no correlation between the proportion of Cape Verdeans and poverty level among boys under the age of 16 in the United States with a correlation coefficient (R) of -0.019 and weighted average of 18.7%. Similarly, the statistical analysis conducted on geographies consisting of 461,906,754 people shows a poor positive correlation between the proportion of Immigrants from Philippines and poverty level among boys under the age of 16 in the United States with a correlation coefficient (R) of 0.132 and weighted average of 14.3%, a difference of 30.6%.
Child Poverty Among Boys Under 16 Correlation Summary
| Measurement | Cape Verdean | Immigrants from Philippines |
| Minimum | 1.9% | 3.6% |
| Maximum | 43.4% | 52.9% |
| Range | 41.5% | 49.4% |
| Mean | 19.3% | 14.9% |
| Median | 19.1% | 12.9% |
| Interquartile 25% (IQ1) | 13.6% | 9.5% |
| Interquartile 75% (IQ3) | 24.5% | 15.7% |
| Interquartile Range (IQR) | 10.9% | 6.2% |
| Standard Deviation (Sample) | 8.2% | 9.1% |
| Standard Deviation (Population) | 8.1% | 9.0% |
Similar Demographics by Child Poverty Among Boys Under 16
Demographics Similar to Cape Verdeans by Child Poverty Among Boys Under 16
In terms of child poverty among boys under 16, the demographic groups most similar to Cape Verdeans are Immigrants from Laos (18.7%, a difference of 0.24%), Immigrants from Cuba (18.8%, a difference of 0.34%), Immigrants from Sudan (18.8%, a difference of 0.39%), Immigrants from Eritrea (18.6%, a difference of 0.45%), and Sudanese (18.6%, a difference of 0.61%).
| Demographics | Rating | Rank | Child Poverty Among Boys Under 16 |
| Marshallese | 1.3 /100 | #232 | Tragic 18.4% |
| Immigrants | Nigeria | 1.2 /100 | #233 | Tragic 18.4% |
| Nigerians | 1.1 /100 | #234 | Tragic 18.5% |
| Americans | 0.9 /100 | #235 | Tragic 18.6% |
| Sudanese | 0.9 /100 | #236 | Tragic 18.6% |
| Immigrants | Eritrea | 0.8 /100 | #237 | Tragic 18.6% |
| Immigrants | Laos | 0.8 /100 | #238 | Tragic 18.7% |
| Cape Verdeans | 0.7 /100 | #239 | Tragic 18.7% |
| Immigrants | Cuba | 0.6 /100 | #240 | Tragic 18.8% |
| Immigrants | Sudan | 0.6 /100 | #241 | Tragic 18.8% |
| Ghanaians | 0.5 /100 | #242 | Tragic 18.9% |
| Immigrants | Azores | 0.4 /100 | #243 | Tragic 18.9% |
| Immigrants | Middle Africa | 0.4 /100 | #244 | Tragic 18.9% |
| Cree | 0.4 /100 | #245 | Tragic 19.0% |
| Immigrants | Nicaragua | 0.4 /100 | #246 | Tragic 19.0% |
Demographics Similar to Immigrants from Philippines by Child Poverty Among Boys Under 16
In terms of child poverty among boys under 16, the demographic groups most similar to Immigrants from Philippines are Laotian (14.3%, a difference of 0.040%), Immigrants from Serbia (14.3%, a difference of 0.080%), Immigrants from Pakistan (14.3%, a difference of 0.13%), Zimbabwean (14.3%, a difference of 0.13%), and Polish (14.4%, a difference of 0.24%).
| Demographics | Rating | Rank | Child Poverty Among Boys Under 16 |
| Greeks | 99.4 /100 | #46 | Exceptional 14.1% |
| Immigrants | Moldova | 99.4 /100 | #47 | Exceptional 14.1% |
| Immigrants | Indonesia | 99.4 /100 | #48 | Exceptional 14.1% |
| Czechs | 99.3 /100 | #49 | Exceptional 14.1% |
| Italians | 99.2 /100 | #50 | Exceptional 14.2% |
| Immigrants | Greece | 99.2 /100 | #51 | Exceptional 14.2% |
| Laotians | 99.0 /100 | #52 | Exceptional 14.3% |
| Immigrants | Philippines | 99.0 /100 | #53 | Exceptional 14.3% |
| Immigrants | Serbia | 99.0 /100 | #54 | Exceptional 14.3% |
| Immigrants | Pakistan | 99.0 /100 | #55 | Exceptional 14.3% |
| Zimbabweans | 99.0 /100 | #56 | Exceptional 14.3% |
| Poles | 98.9 /100 | #57 | Exceptional 14.4% |
| Immigrants | Sweden | 98.9 /100 | #58 | Exceptional 14.4% |
| Immigrants | Czechoslovakia | 98.9 /100 | #59 | Exceptional 14.4% |
| Immigrants | Belgium | 98.9 /100 | #60 | Exceptional 14.4% |