Immigrants from Ethiopia vs Immigrants from India Female Poverty
COMPARE
Immigrants from Ethiopia
Immigrants from India
Female Poverty
Female Poverty Comparison
Immigrants from Ethiopia
Immigrants from India
13.3%
FEMALE POVERTY
62.5/ 100
METRIC RATING
161st/ 347
METRIC RANK
9.9%
FEMALE POVERTY
100.0/ 100
METRIC RATING
1st/ 347
METRIC RANK
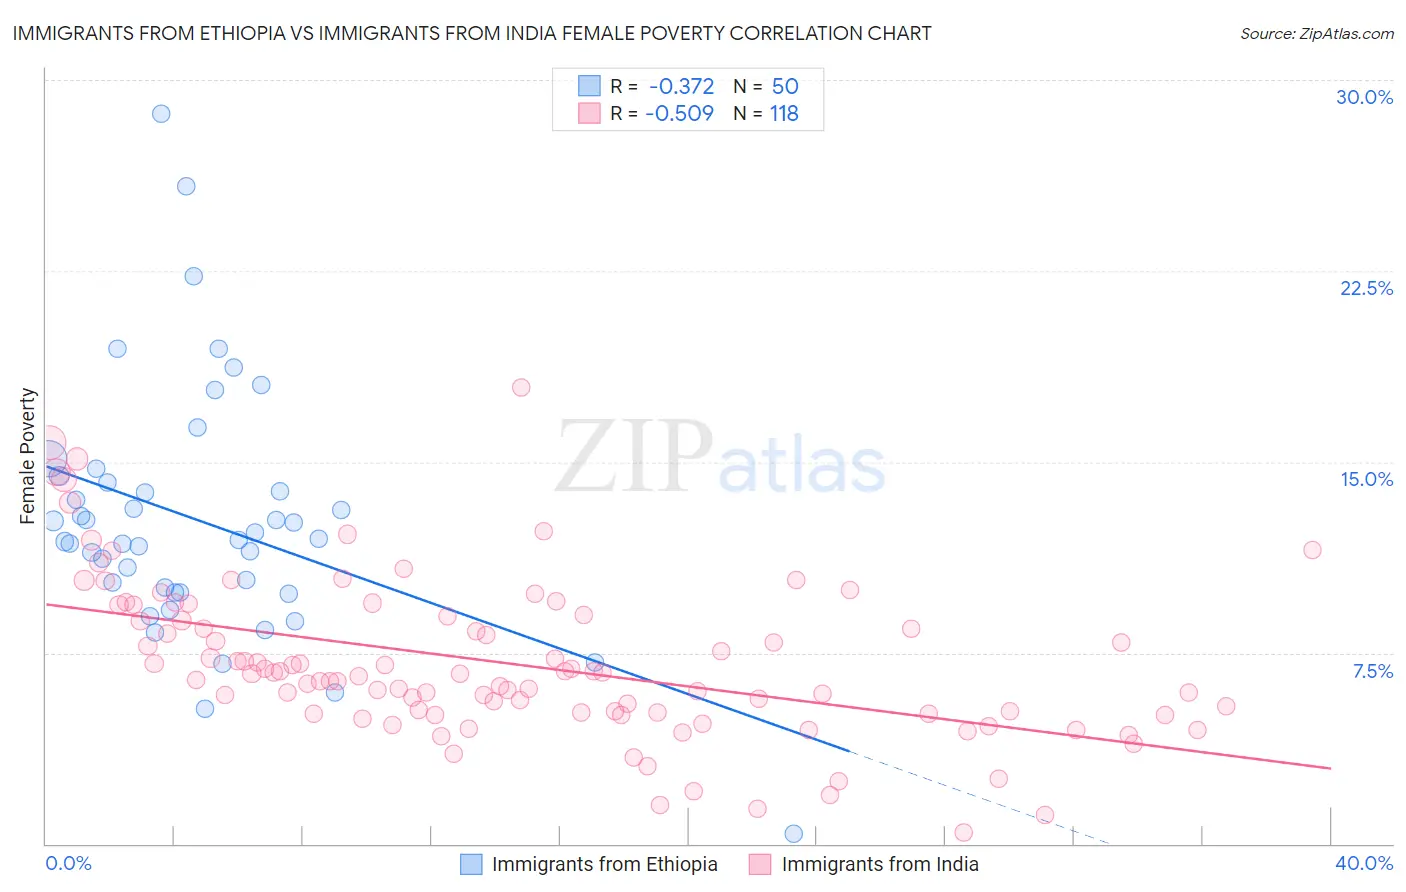
Immigrants from Ethiopia vs Immigrants from India Female Poverty Correlation Chart
The statistical analysis conducted on geographies consisting of 211,427,583 people shows a mild negative correlation between the proportion of Immigrants from Ethiopia and poverty level among females in the United States with a correlation coefficient (R) of -0.372 and weighted average of 13.3%. Similarly, the statistical analysis conducted on geographies consisting of 433,627,117 people shows a substantial negative correlation between the proportion of Immigrants from India and poverty level among females in the United States with a correlation coefficient (R) of -0.509 and weighted average of 9.9%, a difference of 34.4%.
Female Poverty Correlation Summary
| Measurement | Immigrants from Ethiopia | Immigrants from India |
| Minimum | 0.38% | 0.46% |
| Maximum | 28.7% | 17.9% |
| Range | 28.3% | 17.5% |
| Mean | 12.7% | 7.1% |
| Median | 12.0% | 6.7% |
| Interquartile 25% (IQ1) | 9.9% | 5.1% |
| Interquartile 75% (IQ3) | 14.2% | 9.0% |
| Interquartile Range (IQR) | 4.4% | 3.8% |
| Standard Deviation (Sample) | 4.9% | 3.1% |
| Standard Deviation (Population) | 4.9% | 3.1% |
Similar Demographics by Female Poverty
Demographics Similar to Immigrants from Ethiopia by Female Poverty
In terms of female poverty, the demographic groups most similar to Immigrants from Ethiopia are Guamanian/Chamorro (13.3%, a difference of 0.010%), Immigrants from Albania (13.3%, a difference of 0.010%), Ethiopian (13.3%, a difference of 0.020%), Immigrants from Nepal (13.3%, a difference of 0.030%), and Scotch-Irish (13.3%, a difference of 0.040%).
| Demographics | Rating | Rank | Female Poverty |
| Armenians | 70.4 /100 | #154 | Good 13.2% |
| Hungarians | 70.1 /100 | #155 | Good 13.2% |
| Immigrants | Bosnia and Herzegovina | 69.7 /100 | #156 | Good 13.2% |
| Immigrants | Northern Africa | 68.8 /100 | #157 | Good 13.2% |
| Pennsylvania Germans | 67.3 /100 | #158 | Good 13.2% |
| Costa Ricans | 63.6 /100 | #159 | Good 13.3% |
| Immigrants | Nepal | 62.7 /100 | #160 | Good 13.3% |
| Immigrants | Ethiopia | 62.5 /100 | #161 | Good 13.3% |
| Guamanians/Chamorros | 62.4 /100 | #162 | Good 13.3% |
| Immigrants | Albania | 62.4 /100 | #163 | Good 13.3% |
| Ethiopians | 62.3 /100 | #164 | Good 13.3% |
| Scotch-Irish | 62.1 /100 | #165 | Good 13.3% |
| Immigrants | Oceania | 59.7 /100 | #166 | Average 13.3% |
| Immigrants | Chile | 57.4 /100 | #167 | Average 13.3% |
| Aleuts | 56.7 /100 | #168 | Average 13.4% |
Demographics Similar to Immigrants from India by Female Poverty
In terms of female poverty, the demographic groups most similar to Immigrants from India are Chinese (10.4%, a difference of 5.2%), Thai (10.5%, a difference of 5.9%), Immigrants from Taiwan (10.5%, a difference of 6.7%), Filipino (10.9%, a difference of 10.8%), and Immigrants from Ireland (11.0%, a difference of 11.3%).
| Demographics | Rating | Rank | Female Poverty |
| Immigrants | India | 100.0 /100 | #1 | Exceptional 9.9% |
| Chinese | 100.0 /100 | #2 | Exceptional 10.4% |
| Thais | 100.0 /100 | #3 | Exceptional 10.5% |
| Immigrants | Taiwan | 100.0 /100 | #4 | Exceptional 10.5% |
| Filipinos | 100.0 /100 | #5 | Exceptional 10.9% |
| Immigrants | Ireland | 99.9 /100 | #6 | Exceptional 11.0% |
| Assyrians/Chaldeans/Syriacs | 99.9 /100 | #7 | Exceptional 11.0% |
| Immigrants | South Central Asia | 99.9 /100 | #8 | Exceptional 11.1% |
| Bulgarians | 99.9 /100 | #9 | Exceptional 11.1% |
| Immigrants | Hong Kong | 99.9 /100 | #10 | Exceptional 11.2% |
| Maltese | 99.9 /100 | #11 | Exceptional 11.2% |
| Bhutanese | 99.9 /100 | #12 | Exceptional 11.3% |
| Immigrants | Lithuania | 99.9 /100 | #13 | Exceptional 11.3% |
| Lithuanians | 99.8 /100 | #14 | Exceptional 11.4% |
| Latvians | 99.8 /100 | #15 | Exceptional 11.4% |