Immigrants from Ethiopia vs Menominee Female Poverty
COMPARE
Immigrants from Ethiopia
Menominee
Female Poverty
Female Poverty Comparison
Immigrants from Ethiopia
Menominee
13.3%
FEMALE POVERTY
62.5/ 100
METRIC RATING
161st/ 347
METRIC RANK
17.6%
FEMALE POVERTY
0.0/ 100
METRIC RATING
322nd/ 347
METRIC RANK
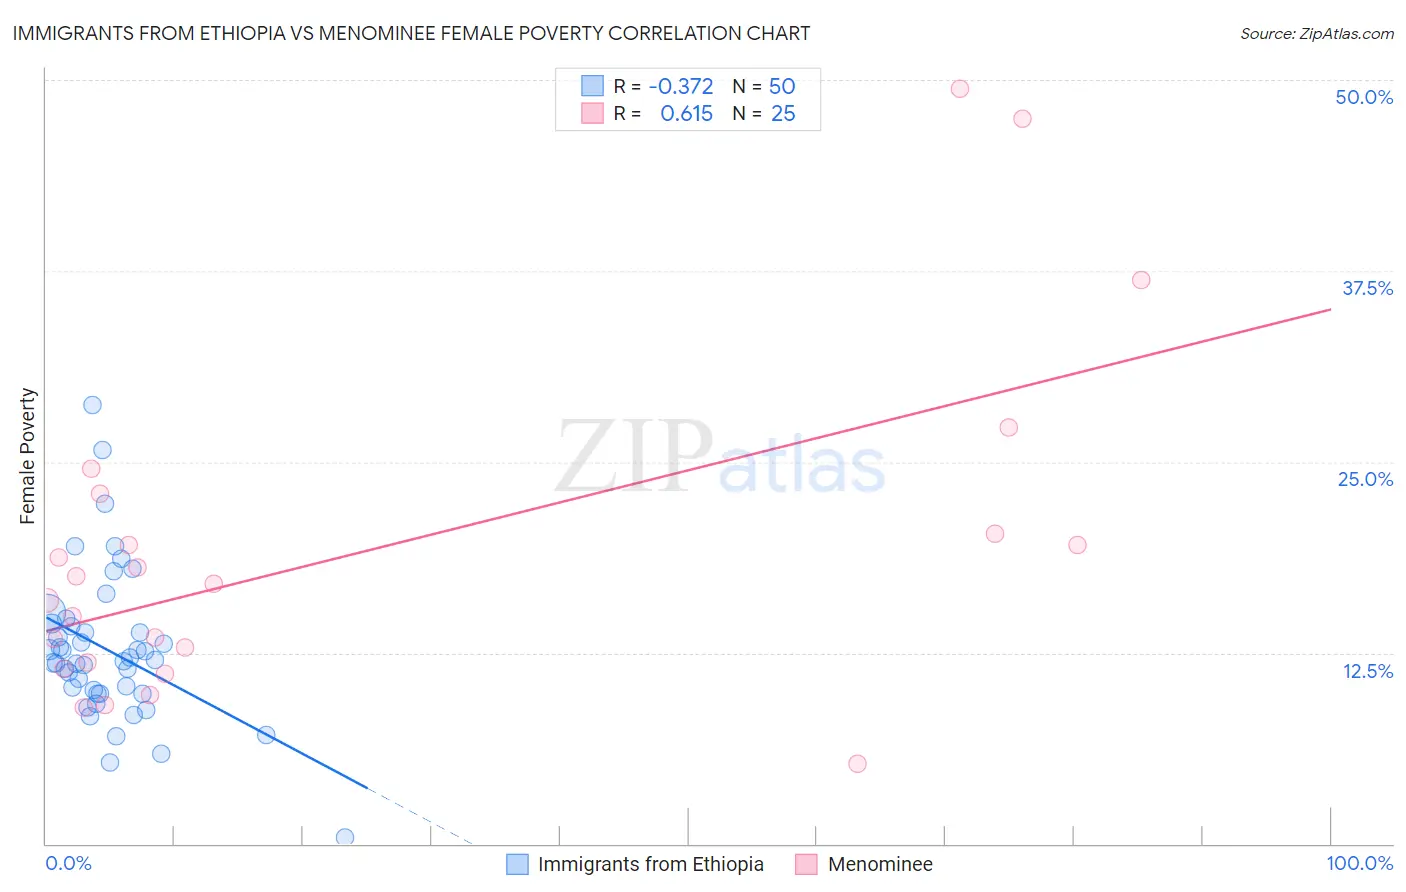
Immigrants from Ethiopia vs Menominee Female Poverty Correlation Chart
The statistical analysis conducted on geographies consisting of 211,427,583 people shows a mild negative correlation between the proportion of Immigrants from Ethiopia and poverty level among females in the United States with a correlation coefficient (R) of -0.372 and weighted average of 13.3%. Similarly, the statistical analysis conducted on geographies consisting of 45,777,591 people shows a significant positive correlation between the proportion of Menominee and poverty level among females in the United States with a correlation coefficient (R) of 0.615 and weighted average of 17.6%, a difference of 32.5%.
Female Poverty Correlation Summary
| Measurement | Immigrants from Ethiopia | Menominee |
| Minimum | 0.38% | 5.2% |
| Maximum | 28.7% | 49.5% |
| Range | 28.3% | 44.2% |
| Mean | 12.7% | 19.1% |
| Median | 12.0% | 17.0% |
| Interquartile 25% (IQ1) | 9.9% | 11.7% |
| Interquartile 75% (IQ3) | 14.2% | 21.6% |
| Interquartile Range (IQR) | 4.4% | 10.0% |
| Standard Deviation (Sample) | 4.9% | 11.1% |
| Standard Deviation (Population) | 4.9% | 10.9% |
Similar Demographics by Female Poverty
Demographics Similar to Immigrants from Ethiopia by Female Poverty
In terms of female poverty, the demographic groups most similar to Immigrants from Ethiopia are Guamanian/Chamorro (13.3%, a difference of 0.010%), Immigrants from Albania (13.3%, a difference of 0.010%), Ethiopian (13.3%, a difference of 0.020%), Immigrants from Nepal (13.3%, a difference of 0.030%), and Scotch-Irish (13.3%, a difference of 0.040%).
| Demographics | Rating | Rank | Female Poverty |
| Armenians | 70.4 /100 | #154 | Good 13.2% |
| Hungarians | 70.1 /100 | #155 | Good 13.2% |
| Immigrants | Bosnia and Herzegovina | 69.7 /100 | #156 | Good 13.2% |
| Immigrants | Northern Africa | 68.8 /100 | #157 | Good 13.2% |
| Pennsylvania Germans | 67.3 /100 | #158 | Good 13.2% |
| Costa Ricans | 63.6 /100 | #159 | Good 13.3% |
| Immigrants | Nepal | 62.7 /100 | #160 | Good 13.3% |
| Immigrants | Ethiopia | 62.5 /100 | #161 | Good 13.3% |
| Guamanians/Chamorros | 62.4 /100 | #162 | Good 13.3% |
| Immigrants | Albania | 62.4 /100 | #163 | Good 13.3% |
| Ethiopians | 62.3 /100 | #164 | Good 13.3% |
| Scotch-Irish | 62.1 /100 | #165 | Good 13.3% |
| Immigrants | Oceania | 59.7 /100 | #166 | Average 13.3% |
| Immigrants | Chile | 57.4 /100 | #167 | Average 13.3% |
| Aleuts | 56.7 /100 | #168 | Average 13.4% |
Demographics Similar to Menominee by Female Poverty
In terms of female poverty, the demographic groups most similar to Menominee are Paiute (17.7%, a difference of 0.59%), Arapaho (17.5%, a difference of 0.65%), Immigrants from Dominica (17.5%, a difference of 0.72%), Immigrants from Honduras (17.7%, a difference of 0.77%), and Cajun (17.5%, a difference of 0.80%).
| Demographics | Rating | Rank | Female Poverty |
| U.S. Virgin Islanders | 0.0 /100 | #315 | Tragic 17.3% |
| Hondurans | 0.0 /100 | #316 | Tragic 17.4% |
| Immigrants | Congo | 0.0 /100 | #317 | Tragic 17.4% |
| Ute | 0.0 /100 | #318 | Tragic 17.5% |
| Cajuns | 0.0 /100 | #319 | Tragic 17.5% |
| Immigrants | Dominica | 0.0 /100 | #320 | Tragic 17.5% |
| Arapaho | 0.0 /100 | #321 | Tragic 17.5% |
| Menominee | 0.0 /100 | #322 | Tragic 17.6% |
| Paiute | 0.0 /100 | #323 | Tragic 17.7% |
| Immigrants | Honduras | 0.0 /100 | #324 | Tragic 17.7% |
| Colville | 0.0 /100 | #325 | Tragic 17.8% |
| Central American Indians | 0.0 /100 | #326 | Tragic 18.0% |
| Yakama | 0.0 /100 | #327 | Tragic 18.0% |
| Blacks/African Americans | 0.0 /100 | #328 | Tragic 18.6% |
| Kiowa | 0.0 /100 | #329 | Tragic 18.6% |