Immigrants from England vs Inupiat Child Poverty Under the Age of 5
COMPARE
Immigrants from England
Inupiat
Child Poverty Under the Age of 5
Child Poverty Under the Age of 5 Comparison
Immigrants from England
Inupiat
16.2%
CHILD POVERTY UNDER THE AGE OF 5
91.5/ 100
METRIC RATING
127th/ 347
METRIC RANK
22.0%
CHILD POVERTY UNDER THE AGE OF 5
0.0/ 100
METRIC RATING
303rd/ 347
METRIC RANK
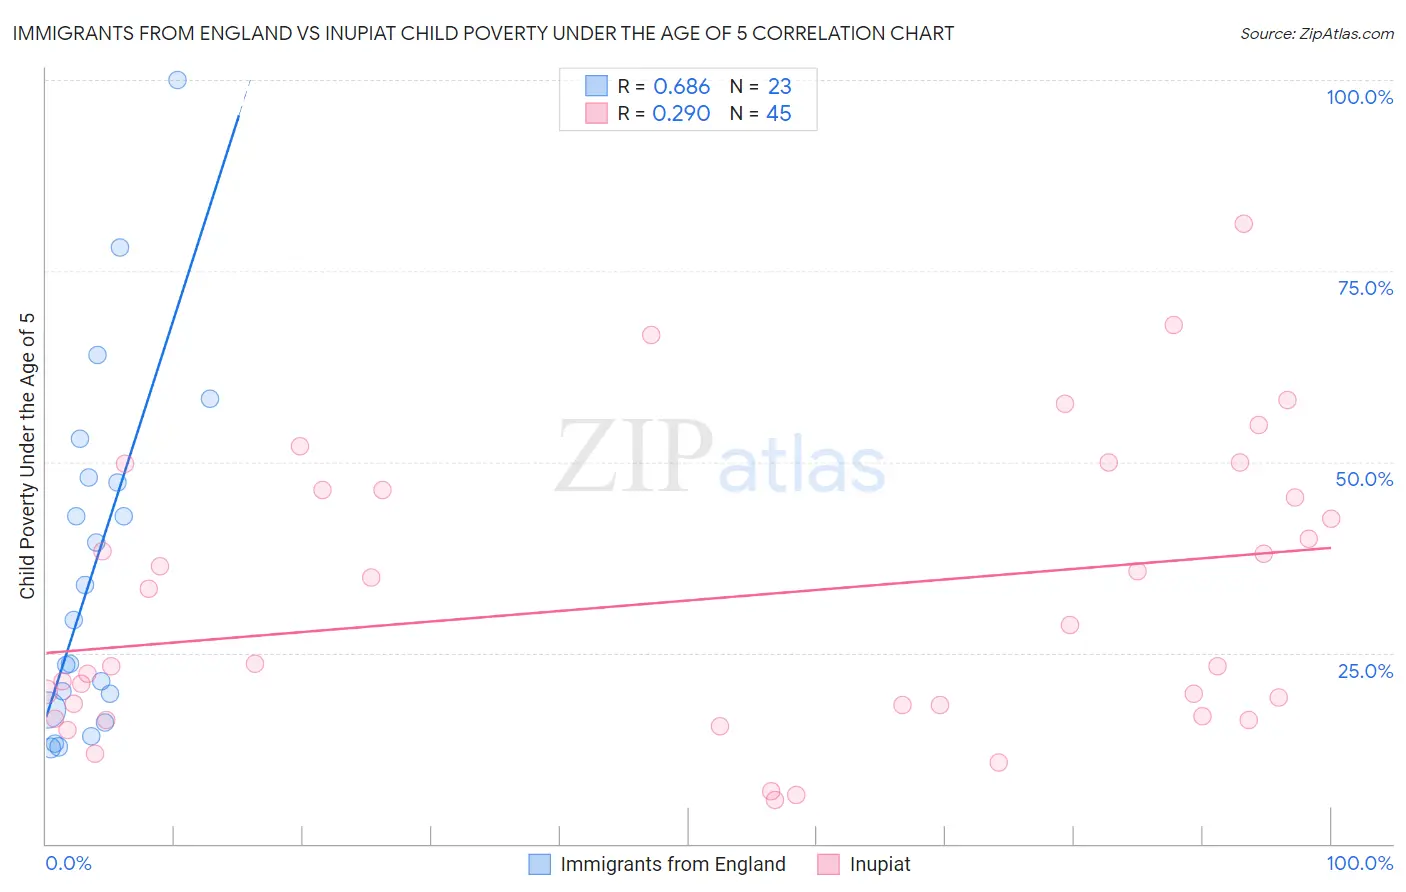
Immigrants from England vs Inupiat Child Poverty Under the Age of 5 Correlation Chart
The statistical analysis conducted on geographies consisting of 373,543,050 people shows a significant positive correlation between the proportion of Immigrants from England and poverty level among children under the age of 5 in the United States with a correlation coefficient (R) of 0.686 and weighted average of 16.2%. Similarly, the statistical analysis conducted on geographies consisting of 95,492,262 people shows a weak positive correlation between the proportion of Inupiat and poverty level among children under the age of 5 in the United States with a correlation coefficient (R) of 0.290 and weighted average of 22.0%, a difference of 36.2%.
Child Poverty Under the Age of 5 Correlation Summary
| Measurement | Immigrants from England | Inupiat |
| Minimum | 12.5% | 5.8% |
| Maximum | 100.0% | 81.2% |
| Range | 87.5% | 75.5% |
| Mean | 36.1% | 32.0% |
| Median | 29.3% | 23.5% |
| Interquartile 25% (IQ1) | 17.6% | 17.4% |
| Interquartile 75% (IQ3) | 48.0% | 46.3% |
| Interquartile Range (IQR) | 30.5% | 28.8% |
| Standard Deviation (Sample) | 23.1% | 18.5% |
| Standard Deviation (Population) | 22.6% | 18.3% |
Similar Demographics by Child Poverty Under the Age of 5
Demographics Similar to Immigrants from England by Child Poverty Under the Age of 5
In terms of child poverty under the age of 5, the demographic groups most similar to Immigrants from England are Immigrants from Albania (16.2%, a difference of 0.080%), Native Hawaiian (16.2%, a difference of 0.090%), Swiss (16.1%, a difference of 0.16%), Austrian (16.1%, a difference of 0.17%), and Immigrants from Southern Europe (16.1%, a difference of 0.19%).
| Demographics | Rating | Rank | Child Poverty Under the Age of 5 |
| Immigrants | Peru | 92.6 /100 | #120 | Exceptional 16.1% |
| Mongolians | 92.5 /100 | #121 | Exceptional 16.1% |
| Immigrants | Southern Europe | 92.0 /100 | #122 | Exceptional 16.1% |
| Austrians | 92.0 /100 | #123 | Exceptional 16.1% |
| Swiss | 92.0 /100 | #124 | Exceptional 16.1% |
| Native Hawaiians | 91.8 /100 | #125 | Exceptional 16.2% |
| Immigrants | Albania | 91.8 /100 | #126 | Exceptional 16.2% |
| Immigrants | England | 91.5 /100 | #127 | Exceptional 16.2% |
| South Africans | 90.1 /100 | #128 | Exceptional 16.2% |
| British | 89.4 /100 | #129 | Excellent 16.3% |
| Immigrants | Norway | 89.3 /100 | #130 | Excellent 16.3% |
| Finns | 88.3 /100 | #131 | Excellent 16.3% |
| Serbians | 88.2 /100 | #132 | Excellent 16.3% |
| Icelanders | 87.9 /100 | #133 | Excellent 16.3% |
| Immigrants | North Macedonia | 87.8 /100 | #134 | Excellent 16.4% |
Demographics Similar to Inupiat by Child Poverty Under the Age of 5
In terms of child poverty under the age of 5, the demographic groups most similar to Inupiat are Iroquois (22.0%, a difference of 0.090%), Immigrants from Guatemala (22.0%, a difference of 0.11%), Immigrants from Central America (22.0%, a difference of 0.25%), Alaskan Athabascan (21.8%, a difference of 0.91%), and Chickasaw (21.8%, a difference of 0.92%).
| Demographics | Rating | Rank | Child Poverty Under the Age of 5 |
| Yaqui | 0.0 /100 | #296 | Tragic 21.7% |
| Hispanics or Latinos | 0.0 /100 | #297 | Tragic 21.7% |
| Blackfeet | 0.0 /100 | #298 | Tragic 21.8% |
| Chickasaw | 0.0 /100 | #299 | Tragic 21.8% |
| Alaskan Athabascans | 0.0 /100 | #300 | Tragic 21.8% |
| Immigrants | Central America | 0.0 /100 | #301 | Tragic 22.0% |
| Iroquois | 0.0 /100 | #302 | Tragic 22.0% |
| Inupiat | 0.0 /100 | #303 | Tragic 22.0% |
| Immigrants | Guatemala | 0.0 /100 | #304 | Tragic 22.0% |
| Immigrants | Mexico | 0.0 /100 | #305 | Tragic 22.2% |
| Indonesians | 0.0 /100 | #306 | Tragic 22.3% |
| Immigrants | Bahamas | 0.0 /100 | #307 | Tragic 22.7% |
| Immigrants | Dominica | 0.0 /100 | #308 | Tragic 22.7% |
| Houma | 0.0 /100 | #309 | Tragic 22.7% |
| Africans | 0.0 /100 | #310 | Tragic 22.8% |