Immigrants from England vs Malaysian Child Poverty Under the Age of 5
COMPARE
Immigrants from England
Malaysian
Child Poverty Under the Age of 5
Child Poverty Under the Age of 5 Comparison
Immigrants from England
Malaysians
16.2%
CHILD POVERTY UNDER THE AGE OF 5
91.5/ 100
METRIC RATING
127th/ 347
METRIC RANK
18.4%
CHILD POVERTY UNDER THE AGE OF 5
6.5/ 100
METRIC RATING
214th/ 347
METRIC RANK
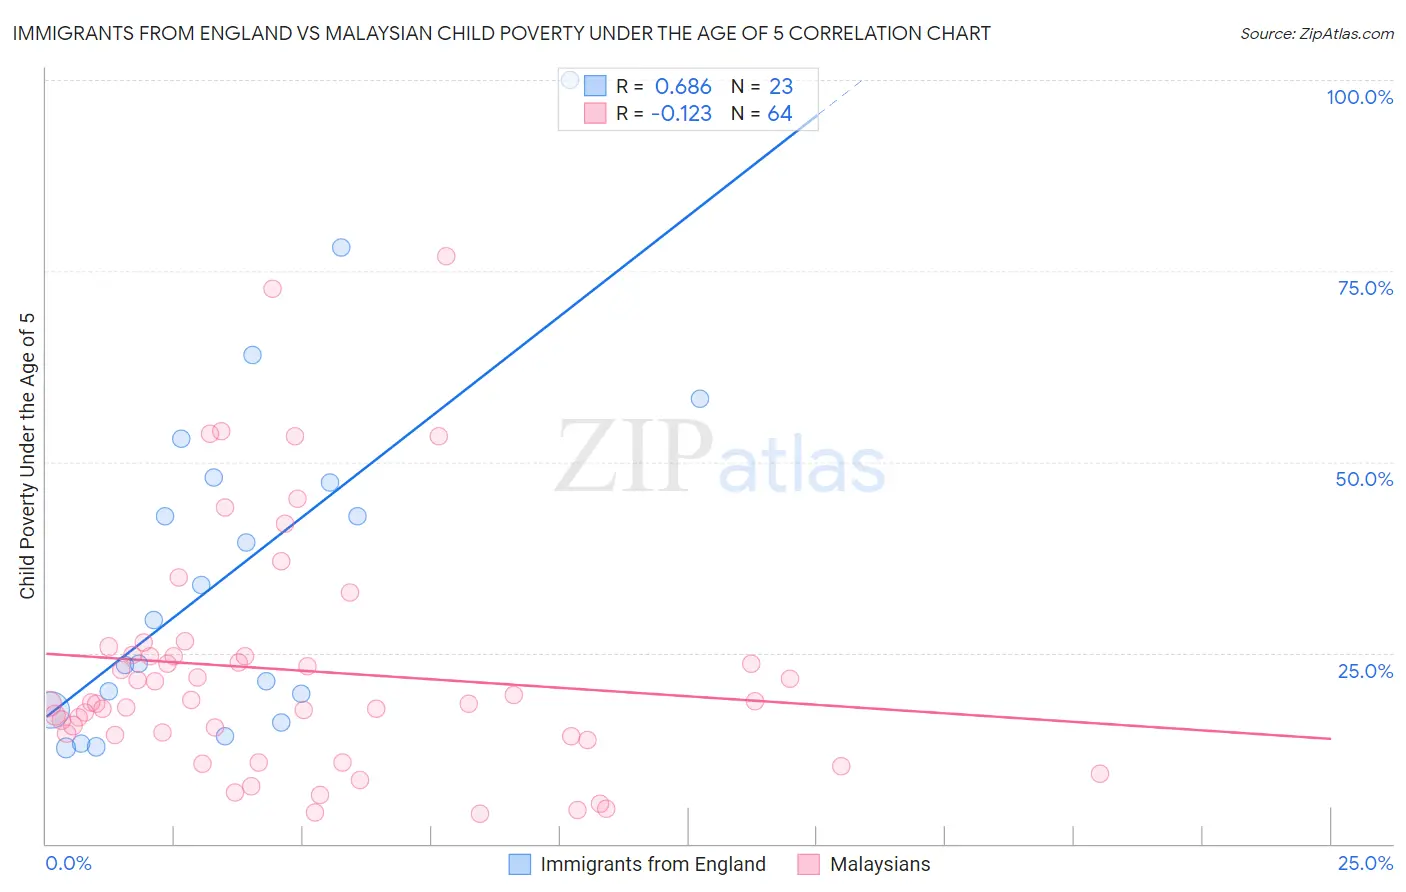
Immigrants from England vs Malaysian Child Poverty Under the Age of 5 Correlation Chart
The statistical analysis conducted on geographies consisting of 373,543,050 people shows a significant positive correlation between the proportion of Immigrants from England and poverty level among children under the age of 5 in the United States with a correlation coefficient (R) of 0.686 and weighted average of 16.2%. Similarly, the statistical analysis conducted on geographies consisting of 221,749,589 people shows a poor negative correlation between the proportion of Malaysians and poverty level among children under the age of 5 in the United States with a correlation coefficient (R) of -0.123 and weighted average of 18.4%, a difference of 14.0%.
Child Poverty Under the Age of 5 Correlation Summary
| Measurement | Immigrants from England | Malaysian |
| Minimum | 12.5% | 4.0% |
| Maximum | 100.0% | 76.9% |
| Range | 87.5% | 73.0% |
| Mean | 36.1% | 22.7% |
| Median | 29.3% | 18.5% |
| Interquartile 25% (IQ1) | 17.6% | 14.1% |
| Interquartile 75% (IQ3) | 48.0% | 24.6% |
| Interquartile Range (IQR) | 30.5% | 10.5% |
| Standard Deviation (Sample) | 23.1% | 15.6% |
| Standard Deviation (Population) | 22.6% | 15.5% |
Similar Demographics by Child Poverty Under the Age of 5
Demographics Similar to Immigrants from England by Child Poverty Under the Age of 5
In terms of child poverty under the age of 5, the demographic groups most similar to Immigrants from England are Immigrants from Albania (16.2%, a difference of 0.080%), Native Hawaiian (16.2%, a difference of 0.090%), Swiss (16.1%, a difference of 0.16%), Austrian (16.1%, a difference of 0.17%), and Immigrants from Southern Europe (16.1%, a difference of 0.19%).
| Demographics | Rating | Rank | Child Poverty Under the Age of 5 |
| Immigrants | Peru | 92.6 /100 | #120 | Exceptional 16.1% |
| Mongolians | 92.5 /100 | #121 | Exceptional 16.1% |
| Immigrants | Southern Europe | 92.0 /100 | #122 | Exceptional 16.1% |
| Austrians | 92.0 /100 | #123 | Exceptional 16.1% |
| Swiss | 92.0 /100 | #124 | Exceptional 16.1% |
| Native Hawaiians | 91.8 /100 | #125 | Exceptional 16.2% |
| Immigrants | Albania | 91.8 /100 | #126 | Exceptional 16.2% |
| Immigrants | England | 91.5 /100 | #127 | Exceptional 16.2% |
| South Africans | 90.1 /100 | #128 | Exceptional 16.2% |
| British | 89.4 /100 | #129 | Excellent 16.3% |
| Immigrants | Norway | 89.3 /100 | #130 | Excellent 16.3% |
| Finns | 88.3 /100 | #131 | Excellent 16.3% |
| Serbians | 88.2 /100 | #132 | Excellent 16.3% |
| Icelanders | 87.9 /100 | #133 | Excellent 16.3% |
| Immigrants | North Macedonia | 87.8 /100 | #134 | Excellent 16.4% |
Demographics Similar to Malaysians by Child Poverty Under the Age of 5
In terms of child poverty under the age of 5, the demographic groups most similar to Malaysians are Immigrants from Panama (18.5%, a difference of 0.20%), Hmong (18.5%, a difference of 0.66%), Immigrants from Thailand (18.3%, a difference of 0.76%), Nepalese (18.3%, a difference of 0.78%), and Immigrants from Africa (18.6%, a difference of 0.87%).
| Demographics | Rating | Rank | Child Poverty Under the Age of 5 |
| Immigrants | Immigrants | 9.9 /100 | #207 | Tragic 18.2% |
| Scotch-Irish | 9.8 /100 | #208 | Tragic 18.2% |
| Spanish | 9.8 /100 | #209 | Tragic 18.2% |
| Panamanians | 9.7 /100 | #210 | Tragic 18.2% |
| Moroccans | 9.4 /100 | #211 | Tragic 18.2% |
| Nepalese | 8.7 /100 | #212 | Tragic 18.3% |
| Immigrants | Thailand | 8.6 /100 | #213 | Tragic 18.3% |
| Malaysians | 6.5 /100 | #214 | Tragic 18.4% |
| Immigrants | Panama | 6.0 /100 | #215 | Tragic 18.5% |
| Hmong | 5.0 /100 | #216 | Tragic 18.5% |
| Immigrants | Africa | 4.6 /100 | #217 | Tragic 18.6% |
| Delaware | 3.4 /100 | #218 | Tragic 18.7% |
| German Russians | 3.0 /100 | #219 | Tragic 18.8% |
| Immigrants | Azores | 2.6 /100 | #220 | Tragic 18.9% |
| Immigrants | Nigeria | 2.1 /100 | #221 | Tragic 19.0% |