Immigrants from Eastern Asia vs Ottawa Female Poverty
COMPARE
Immigrants from Eastern Asia
Ottawa
Female Poverty
Female Poverty Comparison
Immigrants from Eastern Asia
Ottawa
12.2%
FEMALE POVERTY
97.8/ 100
METRIC RATING
67th/ 347
METRIC RANK
15.5%
FEMALE POVERTY
0.2/ 100
METRIC RATING
255th/ 347
METRIC RANK
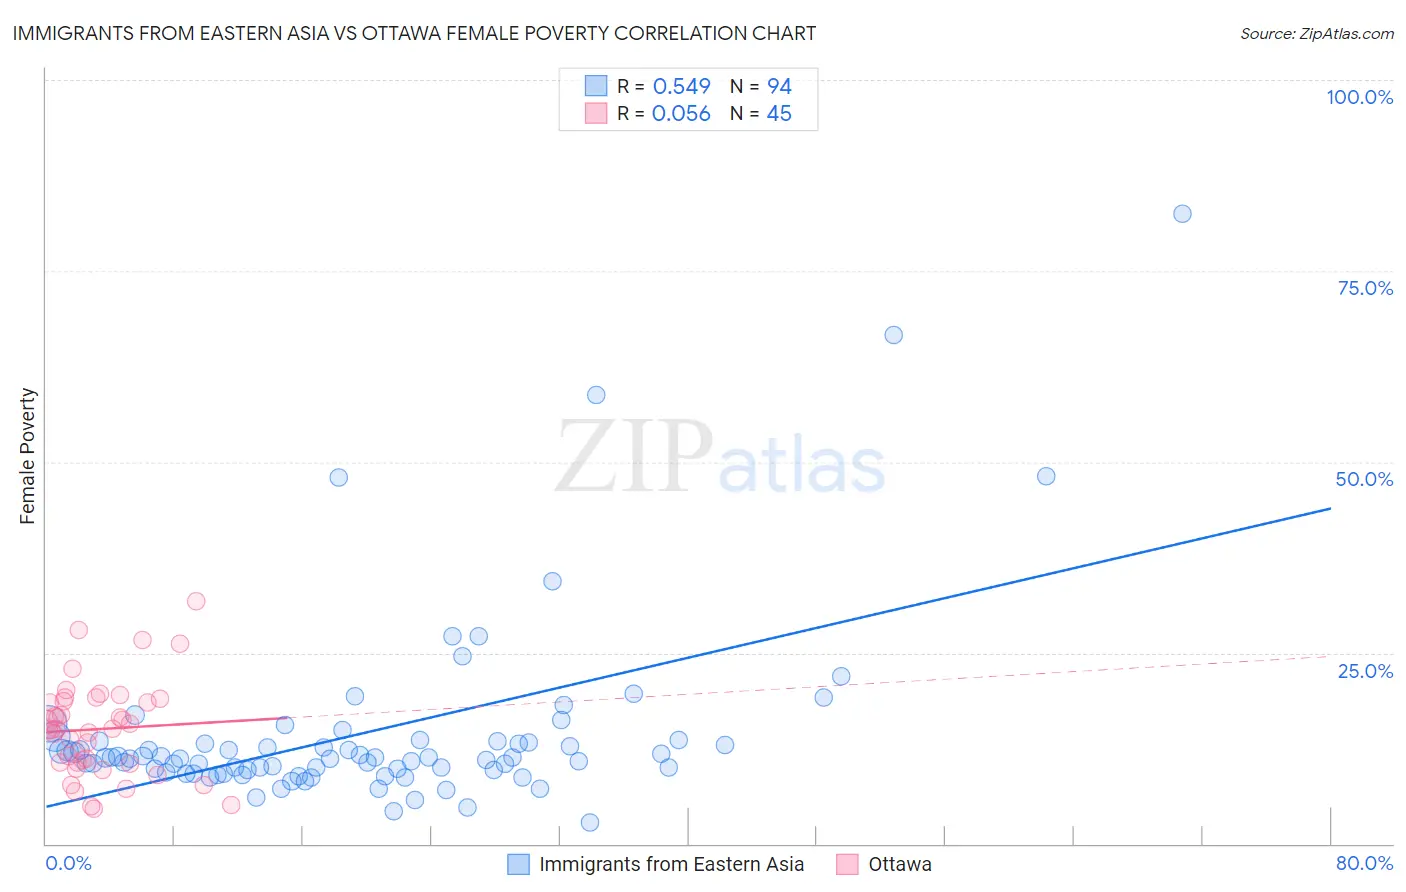
Immigrants from Eastern Asia vs Ottawa Female Poverty Correlation Chart
The statistical analysis conducted on geographies consisting of 499,182,216 people shows a substantial positive correlation between the proportion of Immigrants from Eastern Asia and poverty level among females in the United States with a correlation coefficient (R) of 0.549 and weighted average of 12.2%. Similarly, the statistical analysis conducted on geographies consisting of 49,943,678 people shows a slight positive correlation between the proportion of Ottawa and poverty level among females in the United States with a correlation coefficient (R) of 0.056 and weighted average of 15.5%, a difference of 26.8%.
Female Poverty Correlation Summary
| Measurement | Immigrants from Eastern Asia | Ottawa |
| Minimum | 2.9% | 4.6% |
| Maximum | 82.5% | 31.7% |
| Range | 79.7% | 27.1% |
| Mean | 14.5% | 15.0% |
| Median | 11.3% | 15.0% |
| Interquartile 25% (IQ1) | 9.7% | 10.5% |
| Interquartile 75% (IQ3) | 13.5% | 18.9% |
| Interquartile Range (IQR) | 3.8% | 8.3% |
| Standard Deviation (Sample) | 12.4% | 6.2% |
| Standard Deviation (Population) | 12.3% | 6.1% |
Similar Demographics by Female Poverty
Demographics Similar to Immigrants from Eastern Asia by Female Poverty
In terms of female poverty, the demographic groups most similar to Immigrants from Eastern Asia are Immigrants from Netherlands (12.2%, a difference of 0.040%), Austrian (12.2%, a difference of 0.13%), Indian (Asian) (12.2%, a difference of 0.14%), Swiss (12.2%, a difference of 0.14%), and German (12.2%, a difference of 0.17%).
| Demographics | Rating | Rank | Female Poverty |
| Immigrants | Australia | 98.1 /100 | #60 | Exceptional 12.2% |
| Immigrants | Asia | 98.1 /100 | #61 | Exceptional 12.2% |
| Immigrants | Italy | 98.0 /100 | #62 | Exceptional 12.2% |
| Ukrainians | 98.0 /100 | #63 | Exceptional 12.2% |
| Germans | 98.0 /100 | #64 | Exceptional 12.2% |
| Indians (Asian) | 97.9 /100 | #65 | Exceptional 12.2% |
| Austrians | 97.9 /100 | #66 | Exceptional 12.2% |
| Immigrants | Eastern Asia | 97.8 /100 | #67 | Exceptional 12.2% |
| Immigrants | Netherlands | 97.8 /100 | #68 | Exceptional 12.2% |
| Swiss | 97.7 /100 | #69 | Exceptional 12.2% |
| Immigrants | Belgium | 97.7 /100 | #70 | Exceptional 12.2% |
| Carpatho Rusyns | 97.6 /100 | #71 | Exceptional 12.2% |
| Cambodians | 97.5 /100 | #72 | Exceptional 12.2% |
| Zimbabweans | 97.5 /100 | #73 | Exceptional 12.3% |
| Immigrants | Canada | 97.5 /100 | #74 | Exceptional 12.3% |
Demographics Similar to Ottawa by Female Poverty
In terms of female poverty, the demographic groups most similar to Ottawa are Jamaican (15.5%, a difference of 0.30%), Trinidadian and Tobagonian (15.4%, a difference of 0.31%), Immigrants from Jamaica (15.6%, a difference of 0.43%), Shoshone (15.6%, a difference of 0.49%), and Liberian (15.4%, a difference of 0.54%).
| Demographics | Rating | Rank | Female Poverty |
| Immigrants | Ghana | 0.3 /100 | #248 | Tragic 15.3% |
| Salvadorans | 0.3 /100 | #249 | Tragic 15.3% |
| Immigrants | Western Africa | 0.3 /100 | #250 | Tragic 15.3% |
| Immigrants | Trinidad and Tobago | 0.3 /100 | #251 | Tragic 15.4% |
| Immigrants | Burma/Myanmar | 0.3 /100 | #252 | Tragic 15.4% |
| Liberians | 0.2 /100 | #253 | Tragic 15.4% |
| Trinidadians and Tobagonians | 0.2 /100 | #254 | Tragic 15.4% |
| Ottawa | 0.2 /100 | #255 | Tragic 15.5% |
| Jamaicans | 0.2 /100 | #256 | Tragic 15.5% |
| Immigrants | Jamaica | 0.1 /100 | #257 | Tragic 15.6% |
| Shoshone | 0.1 /100 | #258 | Tragic 15.6% |
| Cape Verdeans | 0.1 /100 | #259 | Tragic 15.6% |
| Immigrants | Guyana | 0.1 /100 | #260 | Tragic 15.6% |
| Guyanese | 0.1 /100 | #261 | Tragic 15.6% |
| Mexican American Indians | 0.1 /100 | #262 | Tragic 15.6% |