Dutch West Indian vs Ottawa Female Poverty
COMPARE
Dutch West Indian
Ottawa
Female Poverty
Female Poverty Comparison
Dutch West Indians
Ottawa
17.1%
FEMALE POVERTY
0.0/ 100
METRIC RATING
314th/ 347
METRIC RANK
15.5%
FEMALE POVERTY
0.2/ 100
METRIC RATING
255th/ 347
METRIC RANK
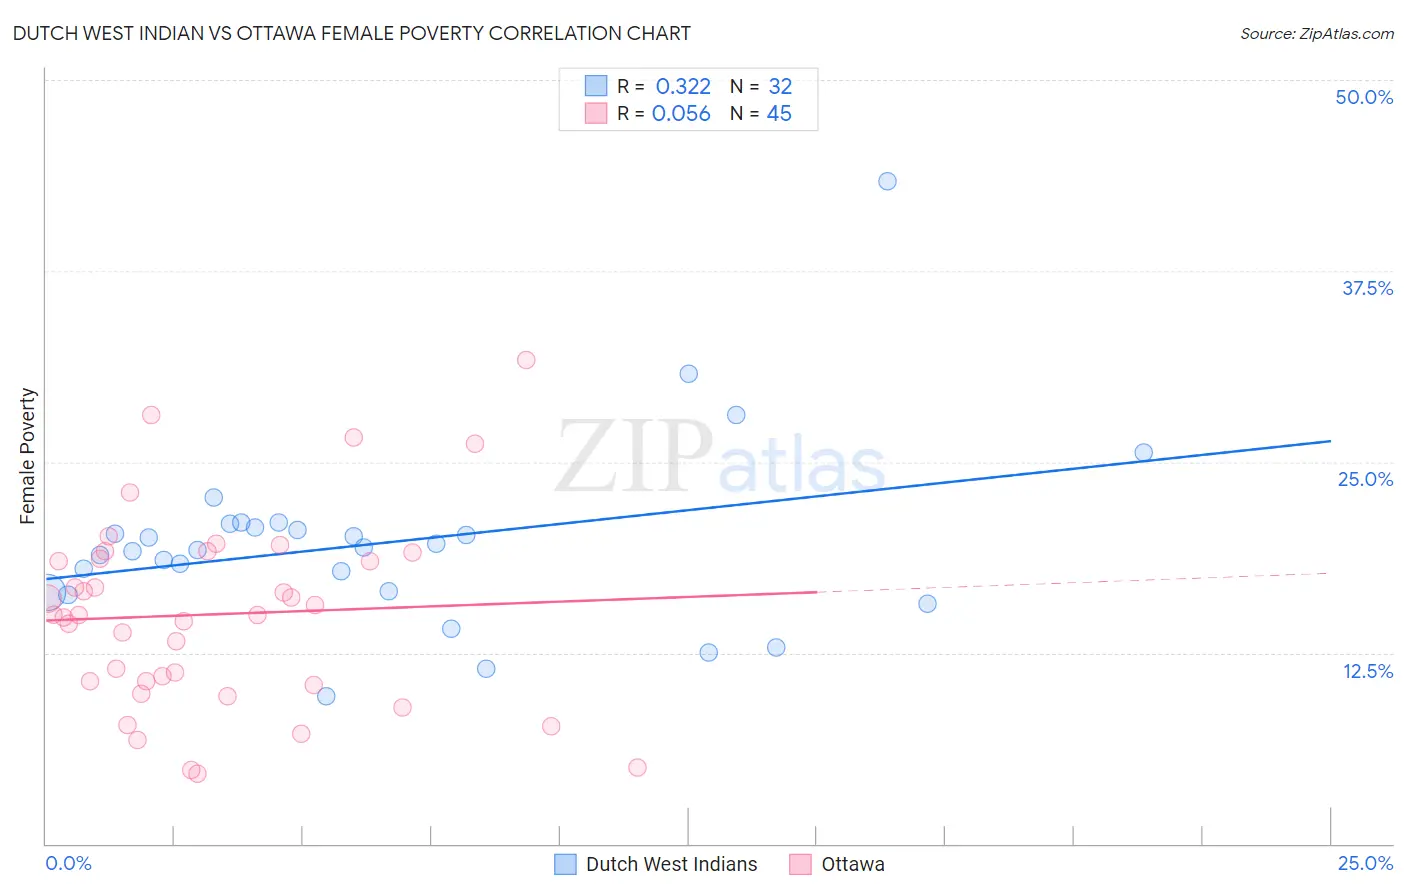
Dutch West Indian vs Ottawa Female Poverty Correlation Chart
The statistical analysis conducted on geographies consisting of 85,761,145 people shows a mild positive correlation between the proportion of Dutch West Indians and poverty level among females in the United States with a correlation coefficient (R) of 0.322 and weighted average of 17.1%. Similarly, the statistical analysis conducted on geographies consisting of 49,943,678 people shows a slight positive correlation between the proportion of Ottawa and poverty level among females in the United States with a correlation coefficient (R) of 0.056 and weighted average of 15.5%, a difference of 10.2%.
Female Poverty Correlation Summary
| Measurement | Dutch West Indian | Ottawa |
| Minimum | 9.6% | 4.6% |
| Maximum | 43.3% | 31.7% |
| Range | 33.7% | 27.1% |
| Mean | 19.7% | 15.0% |
| Median | 19.3% | 15.0% |
| Interquartile 25% (IQ1) | 16.5% | 10.5% |
| Interquartile 75% (IQ3) | 20.8% | 18.9% |
| Interquartile Range (IQR) | 4.3% | 8.3% |
| Standard Deviation (Sample) | 6.1% | 6.2% |
| Standard Deviation (Population) | 6.0% | 6.1% |
Similar Demographics by Female Poverty
Demographics Similar to Dutch West Indians by Female Poverty
In terms of female poverty, the demographic groups most similar to Dutch West Indians are British West Indian (17.0%, a difference of 0.25%), Immigrants from Somalia (17.0%, a difference of 0.33%), Creek (17.0%, a difference of 0.42%), Immigrants from Guatemala (17.0%, a difference of 0.42%), and Immigrants from Mexico (17.0%, a difference of 0.67%).
| Demographics | Rating | Rank | Female Poverty |
| Seminole | 0.0 /100 | #307 | Tragic 16.9% |
| Africans | 0.0 /100 | #308 | Tragic 16.9% |
| Immigrants | Mexico | 0.0 /100 | #309 | Tragic 17.0% |
| Creek | 0.0 /100 | #310 | Tragic 17.0% |
| Immigrants | Guatemala | 0.0 /100 | #311 | Tragic 17.0% |
| Immigrants | Somalia | 0.0 /100 | #312 | Tragic 17.0% |
| British West Indians | 0.0 /100 | #313 | Tragic 17.0% |
| Dutch West Indians | 0.0 /100 | #314 | Tragic 17.1% |
| U.S. Virgin Islanders | 0.0 /100 | #315 | Tragic 17.3% |
| Hondurans | 0.0 /100 | #316 | Tragic 17.4% |
| Immigrants | Congo | 0.0 /100 | #317 | Tragic 17.4% |
| Ute | 0.0 /100 | #318 | Tragic 17.5% |
| Cajuns | 0.0 /100 | #319 | Tragic 17.5% |
| Immigrants | Dominica | 0.0 /100 | #320 | Tragic 17.5% |
| Arapaho | 0.0 /100 | #321 | Tragic 17.5% |
Demographics Similar to Ottawa by Female Poverty
In terms of female poverty, the demographic groups most similar to Ottawa are Jamaican (15.5%, a difference of 0.30%), Trinidadian and Tobagonian (15.4%, a difference of 0.31%), Immigrants from Jamaica (15.6%, a difference of 0.43%), Shoshone (15.6%, a difference of 0.49%), and Liberian (15.4%, a difference of 0.54%).
| Demographics | Rating | Rank | Female Poverty |
| Immigrants | Ghana | 0.3 /100 | #248 | Tragic 15.3% |
| Salvadorans | 0.3 /100 | #249 | Tragic 15.3% |
| Immigrants | Western Africa | 0.3 /100 | #250 | Tragic 15.3% |
| Immigrants | Trinidad and Tobago | 0.3 /100 | #251 | Tragic 15.4% |
| Immigrants | Burma/Myanmar | 0.3 /100 | #252 | Tragic 15.4% |
| Liberians | 0.2 /100 | #253 | Tragic 15.4% |
| Trinidadians and Tobagonians | 0.2 /100 | #254 | Tragic 15.4% |
| Ottawa | 0.2 /100 | #255 | Tragic 15.5% |
| Jamaicans | 0.2 /100 | #256 | Tragic 15.5% |
| Immigrants | Jamaica | 0.1 /100 | #257 | Tragic 15.6% |
| Shoshone | 0.1 /100 | #258 | Tragic 15.6% |
| Cape Verdeans | 0.1 /100 | #259 | Tragic 15.6% |
| Immigrants | Guyana | 0.1 /100 | #260 | Tragic 15.6% |
| Guyanese | 0.1 /100 | #261 | Tragic 15.6% |
| Mexican American Indians | 0.1 /100 | #262 | Tragic 15.6% |