Immigrants from Eastern Asia vs Ethiopian Male Poverty

COMPARE

Immigrants from Eastern Asia
Race
Ancestry
AfghanAfricanAlaska NativeAlaskan AthabascanAlbanianAleutAlsatianAmericanApacheArabArapahoArgentineanArmenianAssyrian/Chaldean/SyriacAustralianAustrianBahamianBangladeshiBarbadianBasqueBelgianBelizeanBermudanBhutaneseBlackfeetBolivianBrazilianBritishBritish West IndianBulgarianBurmeseCajunCambodianCanadianCape VerdeanCarpatho RusynCelticCentral AmericanCentral American IndianCherokeeCheyenneChickasawChileanChineseChippewaChoctawColombianColvilleComancheCosta RicanCreeCreekCroatianCrowCubanCypriotCzechCzechoslovakianDanishDelawareDominicanDutchDutch West IndianEastern EuropeanEcuadorianEgyptianEnglishEstonianEuropeanFijianFilipinoFinnishFrenchFrench American IndianFrench CanadianGermanGerman RussianGhanaianGreekGuamanian/ChamorroGuatemalanGuyaneseHaitianHmongHonduranHopiHoumaHungarianIcelanderIndian (Asian)IndonesianInupiatIranianIraqiIrishIroquoisIsraeliItalianJamaicanJapaneseJordanianKenyanKiowaKoreanLaotianLatvianLebaneseLiberianLithuanianLumbeeLuxembourgerMacedonianMalaysianMalteseMarshalleseMenomineeMexicanMexican American IndianMongolianMoroccanNative HawaiianNavajoNepaleseNew ZealanderNicaraguanNigerianNorthern EuropeanNorwegianOkinawanOsageOttawaPaiutePakistaniPalestinianPanamanianParaguayanPennsylvania GermanPeruvianPimaPolishPortuguesePotawatomiPuebloPuerto RicanPuget Sound SalishRomanianRussianSalvadoranSamoanScandinavianScotch-IrishScottishSeminoleSenegaleseSerbianShoshoneSierra LeoneanSiouxSlavicSlovakSloveneSomaliSouth AfricanSouth AmericanSouth American IndianSoviet UnionSpaniardSpanishSpanish AmericanSpanish American IndianSri LankanSubsaharan AfricanSudaneseSwedishSwissSyrianTaiwaneseThaiTlingit-HaidaTohono O'OdhamTonganTrinidadian and TobagonianTsimshianTurkishU.S. Virgin IslanderUgandanUkrainianUruguayanUteVenezuelanVietnameseWelshWest IndianYakamaYaquiYugoslavianYumanYup'ikZimbabwean
Immigration
NonimmigrantsImmigrantsAfghanistanAfricaAlbaniaArgentinaArmeniaAsiaAustraliaAustriaBahamasBangladeshBarbadosBelarusBelgiumBelizeBoliviaBosnia and HerzegovinaBrazilBulgariaBurma/MyanmarCabo VerdeCambodiaCameroonCanadaCaribbeanCentral AmericaChileChinaColombiaCongoCosta RicaCroatiaCubaCzechoslovakiaDenmarkDominicaDominican RepublicEastern AfricaEastern AsiaEastern EuropeEcuadorEgyptEl SalvadorEnglandEritreaEthiopiaEuropeFijiFranceGermanyGhanaGreeceGrenadaGuatemalaGuyanaHaitiHondurasHong KongHungaryIndiaIndonesiaIranIraqIrelandIsraelItalyJamaicaJapanJordanKazakhstanKenyaKoreaKuwaitLaosLatin AmericaLatviaLebanonLiberiaLithuaniaMalaysiaMexicoMicronesiaMiddle AfricaMoldovaMoroccoNepalNetherlandsNicaraguaNigeriaNorth AmericaNorth MacedoniaNorthern AfricaNorthern EuropeNorwayOceaniaPakistanPanamaPeruPhilippinesPolandPortugalRomaniaRussiaSaudi ArabiaScotlandSenegalSerbiaSierra LeoneSingaporeSomaliaSouth AfricaSouth AmericaSouth Central AsiaSouth Eastern AsiaSouthern EuropeSpainSri LankaSt. Vincent and the GrenadinesSudanSwedenSwitzerlandSyriaTaiwanThailandTrinidad and TobagoTurkeyUgandaUkraineUruguayUzbekistanVenezuelaVietnamWest IndiesWestern AfricaWestern AsiaWestern EuropeYemenZaireZimbabweAzores
Ethiopian
Race
Ancestry
AfghanAfricanAlaska NativeAlaskan AthabascanAlbanianAleutAlsatianAmericanApacheArabArapahoArgentineanArmenianAssyrian/Chaldean/SyriacAustralianAustrianBahamianBangladeshiBarbadianBasqueBelgianBelizeanBermudanBhutaneseBlackfeetBolivianBrazilianBritishBritish West IndianBulgarianBurmeseCajunCambodianCanadianCape VerdeanCarpatho RusynCelticCentral AmericanCentral American IndianCherokeeCheyenneChickasawChileanChineseChippewaChoctawColombianColvilleComancheCosta RicanCreeCreekCroatianCrowCubanCypriotCzechCzechoslovakianDanishDelawareDominicanDutchDutch West IndianEastern EuropeanEcuadorianEgyptianEnglishEstonianEthiopianEuropeanFijianFilipinoFinnishFrenchFrench American IndianFrench CanadianGermanGerman RussianGhanaianGreekGuamanian/ChamorroGuatemalanGuyaneseHaitianHmongHonduranHopiHoumaHungarianIcelanderIndian (Asian)IndonesianInupiatIranianIraqiIrishIroquoisIsraeliItalianJamaicanJapaneseJordanianKenyanKiowaKoreanLaotianLatvianLebaneseLiberianLithuanianLumbeeLuxembourgerMacedonianMalaysianMalteseMarshalleseMenomineeMexicanMexican American IndianMongolianMoroccanNative HawaiianNavajoNepaleseNew ZealanderNicaraguanNigerianNorthern EuropeanNorwegianOkinawanOsageOttawaPaiutePakistaniPalestinianPanamanianParaguayanPennsylvania GermanPeruvianPimaPolishPortuguesePotawatomiPuebloPuerto RicanPuget Sound SalishRomanianRussianSalvadoranSamoanScandinavianScotch-IrishScottishSeminoleSenegaleseSerbianShoshoneSierra LeoneanSiouxSlavicSlovakSloveneSomaliSouth AfricanSouth AmericanSouth American IndianSoviet UnionSpaniardSpanishSpanish AmericanSpanish American IndianSri LankanSubsaharan AfricanSudaneseSwedishSwissSyrianTaiwaneseThaiTlingit-HaidaTohono O'OdhamTonganTrinidadian and TobagonianTsimshianTurkishU.S. Virgin IslanderUgandanUkrainianUruguayanUteVenezuelanVietnameseWelshWest IndianYakamaYaquiYugoslavianYumanYup'ikZimbabwean
Immigration
NonimmigrantsImmigrantsAfghanistanAfricaAlbaniaArgentinaArmeniaAsiaAustraliaAustriaBahamasBangladeshBarbadosBelarusBelgiumBelizeBoliviaBosnia and HerzegovinaBrazilBulgariaBurma/MyanmarCabo VerdeCambodiaCameroonCanadaCaribbeanCentral AmericaChileChinaColombiaCongoCosta RicaCroatiaCubaCzechoslovakiaDenmarkDominicaDominican RepublicEastern AfricaEastern EuropeEcuadorEgyptEl SalvadorEnglandEritreaEthiopiaEuropeFijiFranceGermanyGhanaGreeceGrenadaGuatemalaGuyanaHaitiHondurasHong KongHungaryIndiaIndonesiaIranIraqIrelandIsraelItalyJamaicaJapanJordanKazakhstanKenyaKoreaKuwaitLaosLatin AmericaLatviaLebanonLiberiaLithuaniaMalaysiaMexicoMicronesiaMiddle AfricaMoldovaMoroccoNepalNetherlandsNicaraguaNigeriaNorth AmericaNorth MacedoniaNorthern AfricaNorthern EuropeNorwayOceaniaPakistanPanamaPeruPhilippinesPolandPortugalRomaniaRussiaSaudi ArabiaScotlandSenegalSerbiaSierra LeoneSingaporeSomaliaSouth AfricaSouth AmericaSouth Central AsiaSouth Eastern AsiaSouthern EuropeSpainSri LankaSt. Vincent and the GrenadinesSudanSwedenSwitzerlandSyriaTaiwanThailandTrinidad and TobagoTurkeyUgandaUkraineUruguayUzbekistanVenezuelaVietnamWest IndiesWestern AfricaWestern AsiaWestern EuropeYemenZaireZimbabweAzores
Male Poverty
Income
Poverty
Unemployment
Labor Participation
Family Structure
Vehicle Availability
Education Level
Disability

Male Poverty Comparison

Immigrants from Eastern Asia

Ethiopians

Exceptional
Average
10.4%
MALE POVERTY
95.3/ 100
METRIC RATING
86th/ 347
METRIC RANK
11.1%
MALE POVERTY
56.7/ 100
METRIC RATING
164th/ 347
METRIC RANK

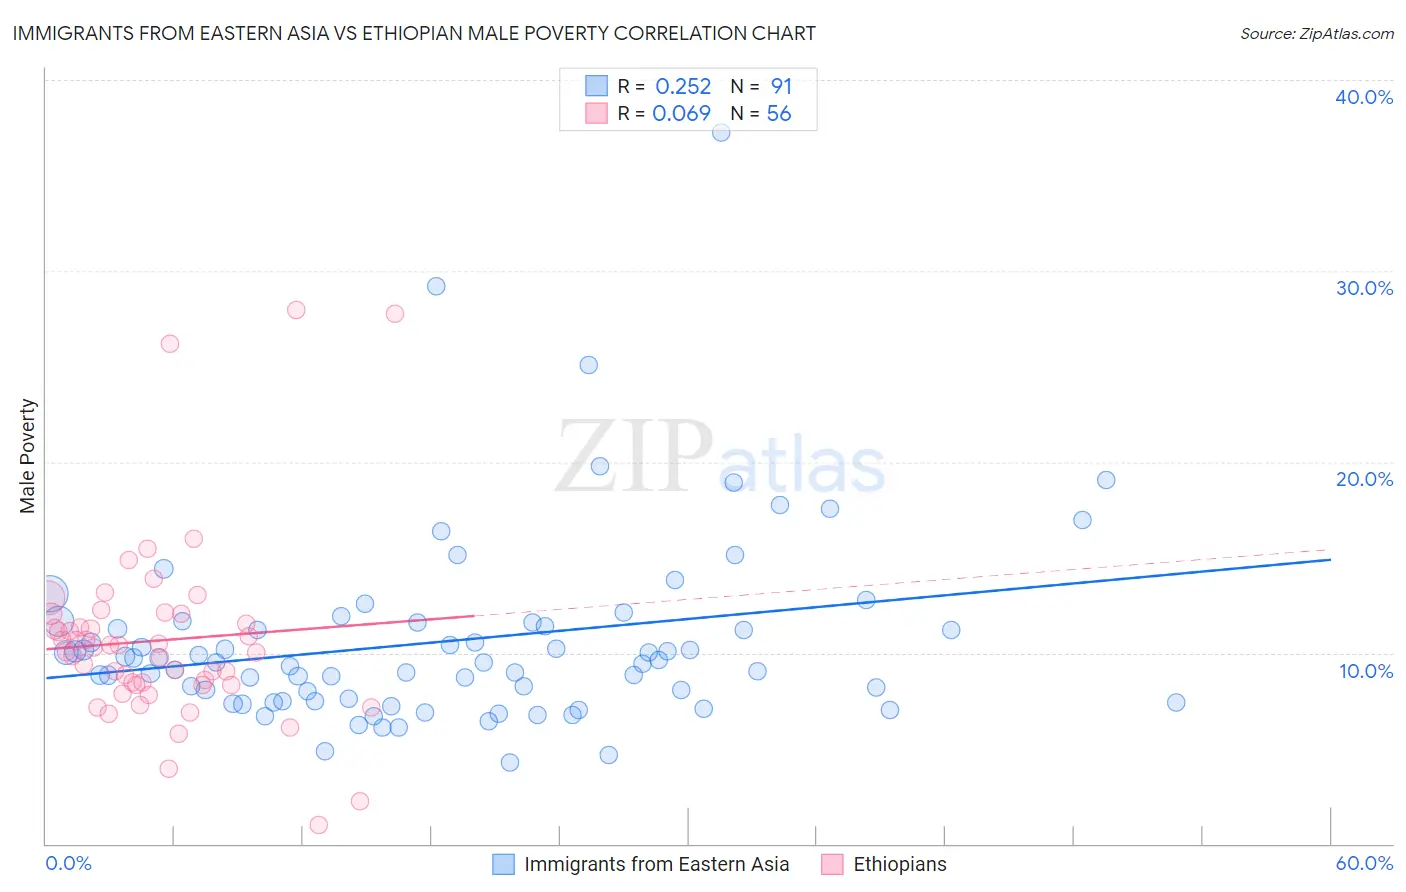
Immigrants from Eastern Asia vs Ethiopian Male Poverty Correlation Chart

The statistical analysis conducted on geographies consisting of 498,983,535 people shows a weak positive correlation between the proportion of Immigrants from Eastern Asia and poverty level among males in the United States with a correlation coefficient (R) of 0.252 and weighted average of 10.4%. Similarly, the statistical analysis conducted on geographies consisting of 223,096,222 people shows a slight positive correlation between the proportion of Ethiopians and poverty level among males in the United States with a correlation coefficient (R) of 0.069 and weighted average of 11.1%, a difference of 7.2%.
Immigrants from Eastern Asia vs Ethiopian Male Poverty

Male Poverty Correlation Summary

MeasurementImmigrants from Eastern AsiaEthiopian
Minimum4.2%1.0%
Maximum37.3%28.0%
Range33.0%27.0%
Mean10.6%10.6%
Median9.5%10.2%
Interquartile 25% (IQ1)7.5%8.3%
Interquartile 75% (IQ3)11.6%11.8%
Interquartile Range (IQR)4.1%3.5%
Standard Deviation (Sample)5.0%4.9%
Standard Deviation (Population)5.0%4.9%

Similar Demographics by Male Poverty

Demographics Similar to Immigrants from Eastern Asia by Male Poverty

In terms of male poverty, the demographic groups most similar to Immigrants from Eastern Asia are Northern European (10.4%, a difference of 0.040%), Immigrants from England (10.4%, a difference of 0.13%), Czechoslovakian (10.3%, a difference of 0.18%), Cambodian (10.4%, a difference of 0.18%), and Immigrants from Denmark (10.4%, a difference of 0.18%).
DemographicsRating | RankMale Poverty
Immigrants | North America
96.5
/100
|
#79
Exceptional
10.3%
English
96.4
/100
|
#80
Exceptional
10.3%
Belgians
95.9
/100
|
#81
Exceptional
10.3%
Egyptians
95.9
/100
|
#82
Exceptional
10.3%
Immigrants | Sweden
95.7
/100
|
#83
Exceptional
10.3%
Czechoslovakians
95.6
/100
|
#84
Exceptional
10.3%
Immigrants | England
95.5
/100
|
#85
Exceptional
10.4%
Immigrants | Eastern Asia
95.3
/100
|
#86
Exceptional
10.4%
Northern Europeans
95.2
/100
|
#87
Exceptional
10.4%
Cambodians
95.0
/100
|
#88
Exceptional
10.4%
Immigrants | Denmark
95.0
/100
|
#89
Exceptional
10.4%
Indians (Asian)
94.9
/100
|
#90
Exceptional
10.4%
British
94.8
/100
|
#91
Exceptional
10.4%
Jordanians
94.4
/100
|
#92
Exceptional
10.4%
Australians
94.4
/100
|
#93
Exceptional
10.4%

Demographics Similar to Ethiopians by Male Poverty

In terms of male poverty, the demographic groups most similar to Ethiopians are White/Caucasian (11.1%, a difference of 0.010%), Immigrants from Chile (11.1%, a difference of 0.070%), Immigrants from Spain (11.1%, a difference of 0.12%), Immigrants from Albania (11.1%, a difference of 0.14%), and Hungarian (11.1%, a difference of 0.16%).
DemographicsRating | RankMale Poverty
Scotch-Irish
63.7
/100
|
#157
Good
11.0%
Colombians
63.0
/100
|
#158
Good
11.0%
Taiwanese
62.7
/100
|
#159
Good
11.0%
Soviet Union
60.3
/100
|
#160
Good
11.1%
Immigrants | Northern Africa
59.7
/100
|
#161
Average
11.1%
Immigrants | Chile
57.4
/100
|
#162
Average
11.1%
Whites/Caucasians
56.7
/100
|
#163
Average
11.1%
Ethiopians
56.7
/100
|
#164
Average
11.1%
Immigrants | Spain
55.5
/100
|
#165
Average
11.1%
Immigrants | Albania
55.3
/100
|
#166
Average
11.1%
Hungarians
55.1
/100
|
#167
Average
11.1%
Immigrants | Portugal
54.9
/100
|
#168
Average
11.1%
Immigrants | Colombia
54.2
/100
|
#169
Average
11.1%
South Americans
53.8
/100
|
#170
Average
11.1%
Uruguayans
51.0
/100
|
#171
Average
11.2%