Immigrants from Eastern Africa vs Trinidadian and Tobagonian Single Female Poverty
COMPARE
Immigrants from Eastern Africa
Trinidadian and Tobagonian
Single Female Poverty
Single Female Poverty Comparison
Immigrants from Eastern Africa
Trinidadians and Tobagonians
21.6%
SINGLE FEMALE POVERTY
15.1/ 100
METRIC RATING
209th/ 347
METRIC RANK
21.2%
SINGLE FEMALE POVERTY
35.2/ 100
METRIC RATING
190th/ 347
METRIC RANK
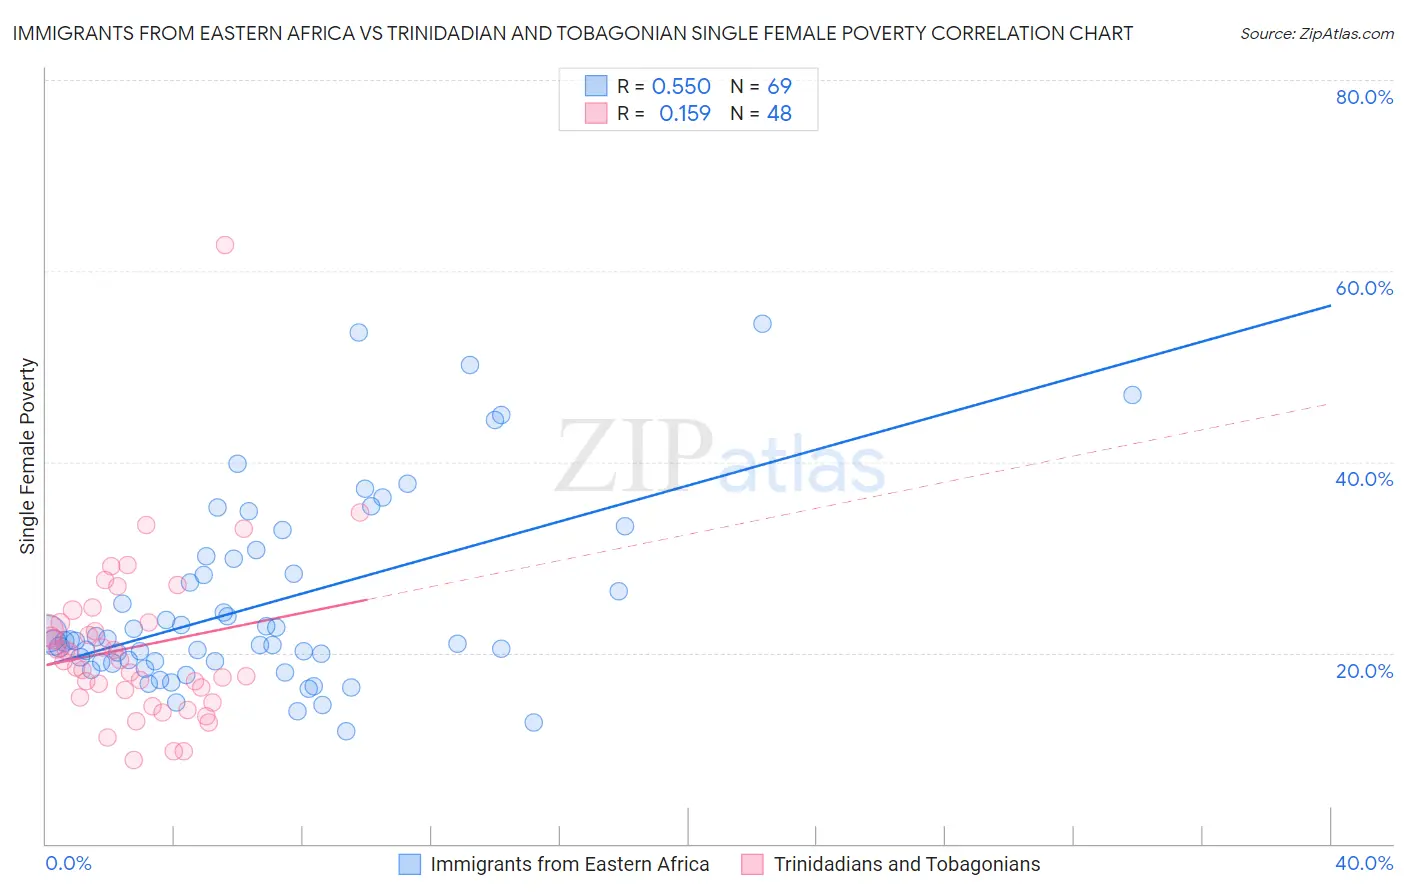
Immigrants from Eastern Africa vs Trinidadian and Tobagonian Single Female Poverty Correlation Chart
The statistical analysis conducted on geographies consisting of 351,272,292 people shows a substantial positive correlation between the proportion of Immigrants from Eastern Africa and poverty level among single females in the United States with a correlation coefficient (R) of 0.550 and weighted average of 21.6%. Similarly, the statistical analysis conducted on geographies consisting of 217,955,182 people shows a poor positive correlation between the proportion of Trinidadians and Tobagonians and poverty level among single females in the United States with a correlation coefficient (R) of 0.159 and weighted average of 21.2%, a difference of 1.7%.
Single Female Poverty Correlation Summary
| Measurement | Immigrants from Eastern Africa | Trinidadian and Tobagonian |
| Minimum | 11.8% | 8.8% |
| Maximum | 54.5% | 62.7% |
| Range | 42.7% | 53.9% |
| Mean | 25.1% | 20.6% |
| Median | 21.3% | 19.2% |
| Interquartile 25% (IQ1) | 19.0% | 15.7% |
| Interquartile 75% (IQ3) | 29.9% | 23.2% |
| Interquartile Range (IQR) | 10.9% | 7.5% |
| Standard Deviation (Sample) | 9.9% | 8.7% |
| Standard Deviation (Population) | 9.8% | 8.6% |
Demographics Similar to Immigrants from Eastern Africa and Trinidadians and Tobagonians by Single Female Poverty
In terms of single female poverty, the demographic groups most similar to Immigrants from Eastern Africa are Haitian (21.6%, a difference of 0.030%), Ghanaian (21.6%, a difference of 0.070%), Belgian (21.5%, a difference of 0.11%), Finnish (21.5%, a difference of 0.12%), and Immigrants from Africa (21.5%, a difference of 0.18%). Similarly, the demographic groups most similar to Trinidadians and Tobagonians are Immigrants from Cuba (21.2%, a difference of 0.0%), Immigrants from Germany (21.3%, a difference of 0.29%), Immigrants from Jamaica (21.3%, a difference of 0.33%), Basque (21.3%, a difference of 0.51%), and Czechoslovakian (21.3%, a difference of 0.54%).
| Demographics | Rating | Rank | Single Female Poverty |
| Immigrants | Cuba | 35.3 /100 | #189 | Fair 21.2% |
| Trinidadians and Tobagonians | 35.2 /100 | #190 | Fair 21.2% |
| Immigrants | Germany | 31.1 /100 | #191 | Fair 21.3% |
| Immigrants | Jamaica | 30.5 /100 | #192 | Fair 21.3% |
| Basques | 28.1 /100 | #193 | Fair 21.3% |
| Czechoslovakians | 27.7 /100 | #194 | Fair 21.3% |
| Nicaraguans | 27.6 /100 | #195 | Fair 21.3% |
| Immigrants | Saudi Arabia | 27.1 /100 | #196 | Fair 21.3% |
| Japanese | 26.4 /100 | #197 | Fair 21.3% |
| Swiss | 24.2 /100 | #198 | Fair 21.4% |
| Immigrants | Immigrants | 22.0 /100 | #199 | Fair 21.4% |
| Irish | 21.4 /100 | #200 | Fair 21.4% |
| Nigerians | 20.9 /100 | #201 | Fair 21.4% |
| Immigrants | Kenya | 20.7 /100 | #202 | Fair 21.4% |
| Immigrants | Haiti | 18.8 /100 | #203 | Poor 21.5% |
| Immigrants | Africa | 16.7 /100 | #204 | Poor 21.5% |
| Finns | 16.2 /100 | #205 | Poor 21.5% |
| Belgians | 16.1 /100 | #206 | Poor 21.5% |
| Ghanaians | 15.7 /100 | #207 | Poor 21.6% |
| Haitians | 15.4 /100 | #208 | Poor 21.6% |
| Immigrants | Eastern Africa | 15.1 /100 | #209 | Poor 21.6% |