Alsatian vs Trinidadian and Tobagonian Single Female Poverty
COMPARE
Alsatian
Trinidadian and Tobagonian
Single Female Poverty
Single Female Poverty Comparison
Alsatians
Trinidadians and Tobagonians
24.5%
SINGLE FEMALE POVERTY
0.0/ 100
METRIC RATING
292nd/ 347
METRIC RANK
21.2%
SINGLE FEMALE POVERTY
35.2/ 100
METRIC RATING
190th/ 347
METRIC RANK
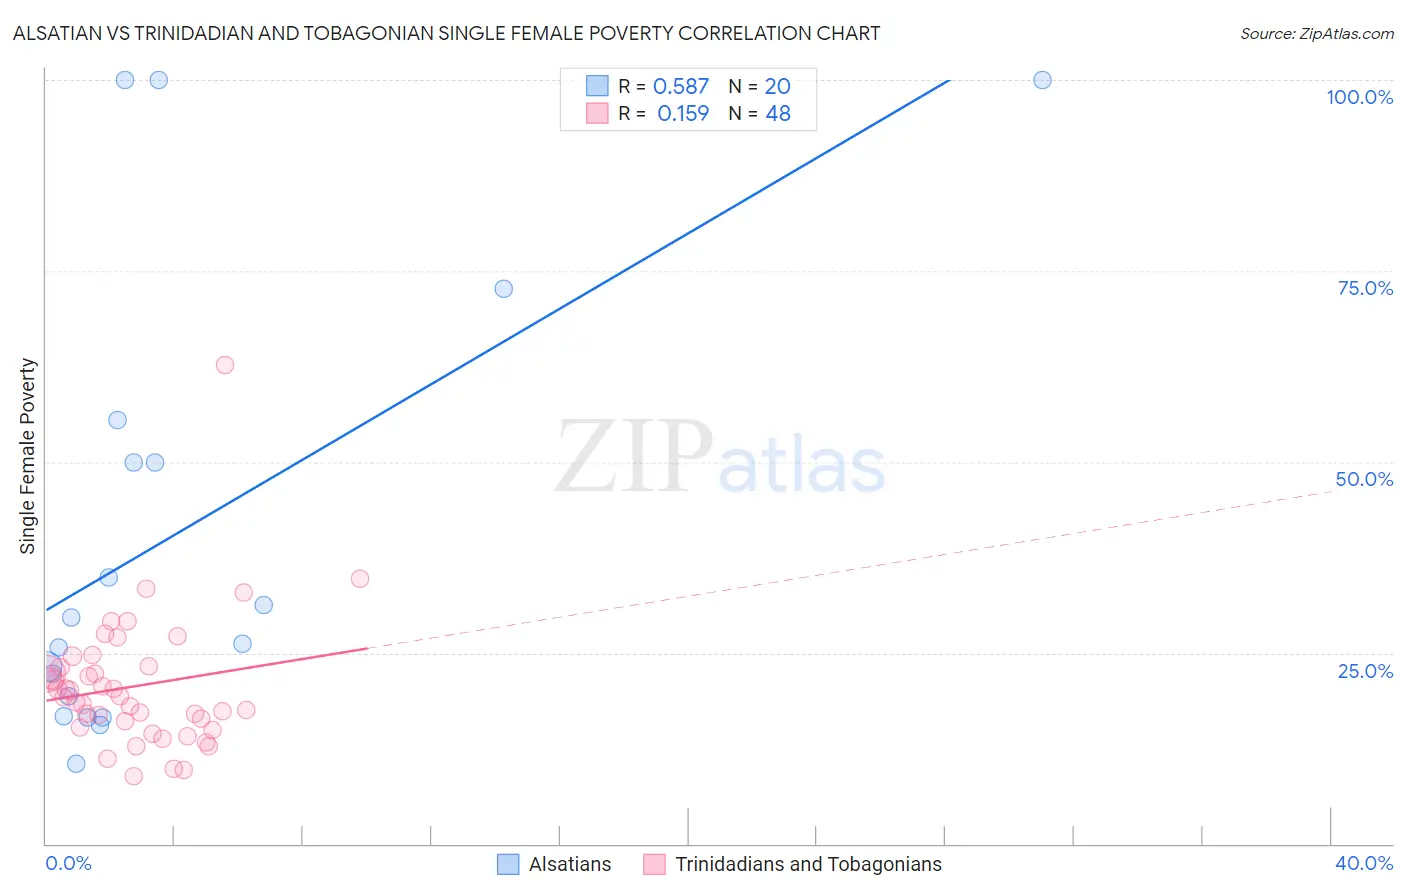
Alsatian vs Trinidadian and Tobagonian Single Female Poverty Correlation Chart
The statistical analysis conducted on geographies consisting of 82,305,024 people shows a substantial positive correlation between the proportion of Alsatians and poverty level among single females in the United States with a correlation coefficient (R) of 0.587 and weighted average of 24.5%. Similarly, the statistical analysis conducted on geographies consisting of 217,955,182 people shows a poor positive correlation between the proportion of Trinidadians and Tobagonians and poverty level among single females in the United States with a correlation coefficient (R) of 0.159 and weighted average of 21.2%, a difference of 15.5%.
Single Female Poverty Correlation Summary
| Measurement | Alsatian | Trinidadian and Tobagonian |
| Minimum | 10.5% | 8.8% |
| Maximum | 100.0% | 62.7% |
| Range | 89.5% | 53.9% |
| Mean | 40.8% | 20.6% |
| Median | 27.9% | 19.2% |
| Interquartile 25% (IQ1) | 18.1% | 15.7% |
| Interquartile 75% (IQ3) | 52.7% | 23.2% |
| Interquartile Range (IQR) | 34.6% | 7.5% |
| Standard Deviation (Sample) | 30.0% | 8.7% |
| Standard Deviation (Population) | 29.2% | 8.6% |
Similar Demographics by Single Female Poverty
Demographics Similar to Alsatians by Single Female Poverty
In terms of single female poverty, the demographic groups most similar to Alsatians are American (24.5%, a difference of 0.080%), French American Indian (24.6%, a difference of 0.23%), Osage (24.4%, a difference of 0.37%), Hispanic or Latino (24.6%, a difference of 0.57%), and Indonesian (24.3%, a difference of 0.97%).
| Demographics | Rating | Rank | Single Female Poverty |
| Immigrants | Guatemala | 0.0 /100 | #285 | Tragic 24.1% |
| Cree | 0.0 /100 | #286 | Tragic 24.1% |
| Bangladeshis | 0.0 /100 | #287 | Tragic 24.2% |
| Spanish Americans | 0.0 /100 | #288 | Tragic 24.2% |
| U.S. Virgin Islanders | 0.0 /100 | #289 | Tragic 24.2% |
| Indonesians | 0.0 /100 | #290 | Tragic 24.3% |
| Osage | 0.0 /100 | #291 | Tragic 24.4% |
| Alsatians | 0.0 /100 | #292 | Tragic 24.5% |
| Americans | 0.0 /100 | #293 | Tragic 24.5% |
| French American Indians | 0.0 /100 | #294 | Tragic 24.6% |
| Hispanics or Latinos | 0.0 /100 | #295 | Tragic 24.6% |
| Africans | 0.0 /100 | #296 | Tragic 24.8% |
| Immigrants | Central America | 0.0 /100 | #297 | Tragic 24.8% |
| Yaqui | 0.0 /100 | #298 | Tragic 24.9% |
| Mexicans | 0.0 /100 | #299 | Tragic 25.0% |
Demographics Similar to Trinidadians and Tobagonians by Single Female Poverty
In terms of single female poverty, the demographic groups most similar to Trinidadians and Tobagonians are Immigrants from Cuba (21.2%, a difference of 0.0%), Yugoslavian (21.2%, a difference of 0.010%), Immigrants from Nigeria (21.2%, a difference of 0.10%), Hawaiian (21.2%, a difference of 0.16%), and Immigrants from Cambodia (21.2%, a difference of 0.20%).
| Demographics | Rating | Rank | Single Female Poverty |
| Slovaks | 39.7 /100 | #183 | Fair 21.1% |
| Hungarians | 39.6 /100 | #184 | Fair 21.1% |
| Immigrants | Cambodia | 38.2 /100 | #185 | Fair 21.2% |
| Hawaiians | 37.7 /100 | #186 | Fair 21.2% |
| Immigrants | Nigeria | 36.8 /100 | #187 | Fair 21.2% |
| Yugoslavians | 35.4 /100 | #188 | Fair 21.2% |
| Immigrants | Cuba | 35.3 /100 | #189 | Fair 21.2% |
| Trinidadians and Tobagonians | 35.2 /100 | #190 | Fair 21.2% |
| Immigrants | Germany | 31.1 /100 | #191 | Fair 21.3% |
| Immigrants | Jamaica | 30.5 /100 | #192 | Fair 21.3% |
| Basques | 28.1 /100 | #193 | Fair 21.3% |
| Czechoslovakians | 27.7 /100 | #194 | Fair 21.3% |
| Nicaraguans | 27.6 /100 | #195 | Fair 21.3% |
| Immigrants | Saudi Arabia | 27.1 /100 | #196 | Fair 21.3% |
| Japanese | 26.4 /100 | #197 | Fair 21.3% |