Immigrants from Dominica vs Swedish Receiving Food Stamps
COMPARE
Immigrants from Dominica
Swedish
Receiving Food Stamps
Receiving Food Stamps Comparison
Immigrants from Dominica
Swedes
18.4%
RECEIVING FOOD STAMPS
0.0/ 100
METRIC RATING
329th/ 347
METRIC RANK
9.2%
RECEIVING FOOD STAMPS
99.8/ 100
METRIC RATING
26th/ 347
METRIC RANK
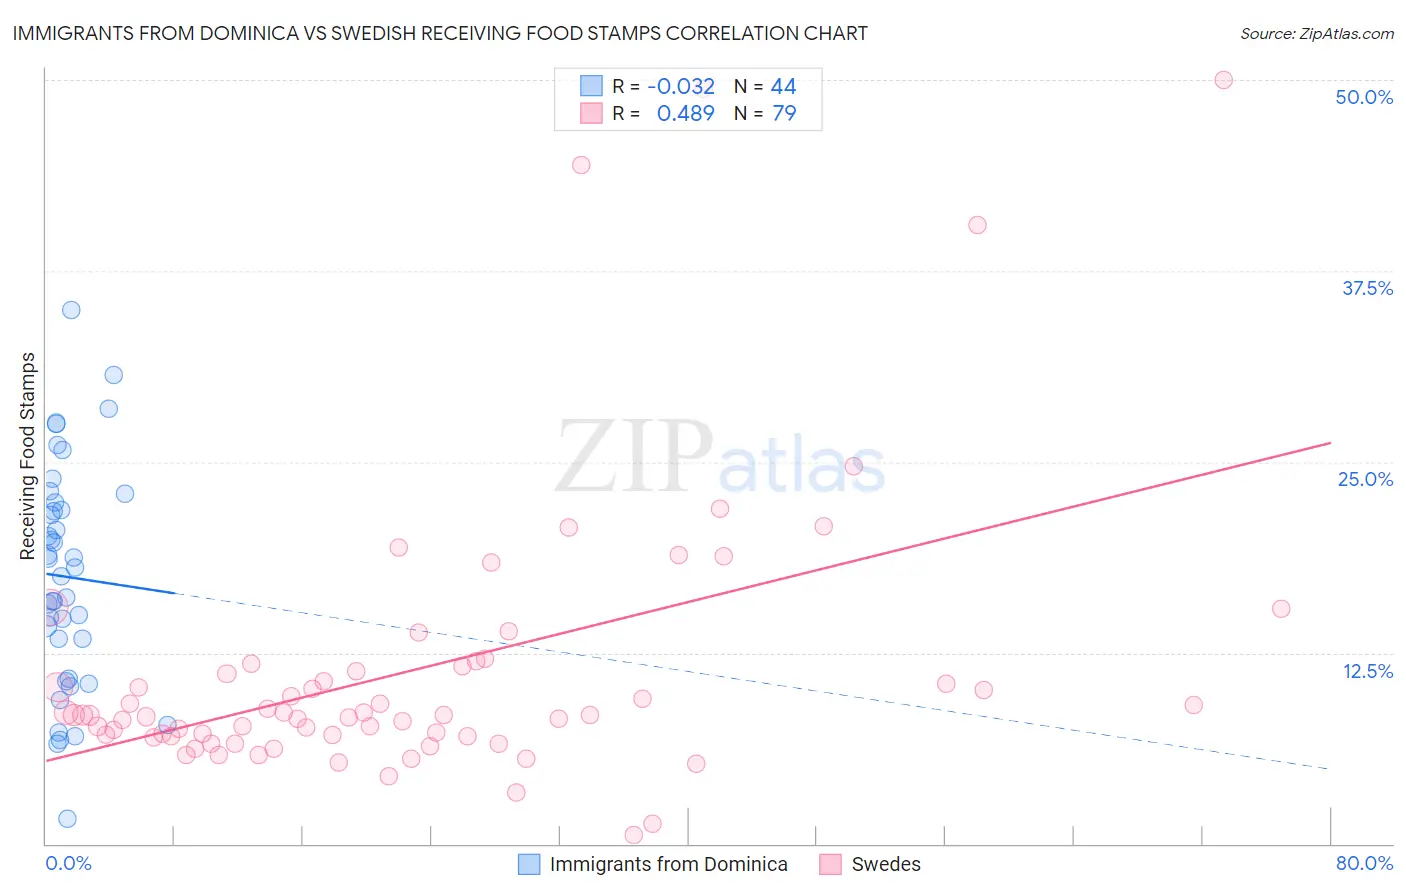
Immigrants from Dominica vs Swedish Receiving Food Stamps Correlation Chart
The statistical analysis conducted on geographies consisting of 83,761,752 people shows no correlation between the proportion of Immigrants from Dominica and percentage of population receiving government assistance and/or food stamps in the United States with a correlation coefficient (R) of -0.032 and weighted average of 18.4%. Similarly, the statistical analysis conducted on geographies consisting of 536,141,990 people shows a moderate positive correlation between the proportion of Swedes and percentage of population receiving government assistance and/or food stamps in the United States with a correlation coefficient (R) of 0.489 and weighted average of 9.2%, a difference of 100.1%.
Receiving Food Stamps Correlation Summary
| Measurement | Immigrants from Dominica | Swedish |
| Minimum | 1.6% | 0.60% |
| Maximum | 35.0% | 50.0% |
| Range | 33.4% | 49.4% |
| Mean | 17.5% | 11.4% |
| Median | 17.8% | 8.4% |
| Interquartile 25% (IQ1) | 12.1% | 7.1% |
| Interquartile 75% (IQ3) | 22.1% | 11.6% |
| Interquartile Range (IQR) | 10.0% | 4.6% |
| Standard Deviation (Sample) | 7.3% | 9.3% |
| Standard Deviation (Population) | 7.2% | 9.2% |
Similar Demographics by Receiving Food Stamps
Demographics Similar to Immigrants from Dominica by Receiving Food Stamps
In terms of receiving food stamps, the demographic groups most similar to Immigrants from Dominica are Colville (18.3%, a difference of 0.46%), Apache (18.3%, a difference of 0.67%), Cuban (18.2%, a difference of 0.98%), Immigrants from Haiti (18.2%, a difference of 1.1%), and British West Indian (17.9%, a difference of 2.9%).
| Demographics | Rating | Rank | Receiving Food Stamps |
| Immigrants | Grenada | 0.0 /100 | #322 | Tragic 17.8% |
| Haitians | 0.0 /100 | #323 | Tragic 17.8% |
| British West Indians | 0.0 /100 | #324 | Tragic 17.9% |
| Immigrants | Haiti | 0.0 /100 | #325 | Tragic 18.2% |
| Cubans | 0.0 /100 | #326 | Tragic 18.2% |
| Apache | 0.0 /100 | #327 | Tragic 18.3% |
| Colville | 0.0 /100 | #328 | Tragic 18.3% |
| Immigrants | Dominica | 0.0 /100 | #329 | Tragic 18.4% |
| Pima | 0.0 /100 | #330 | Tragic 19.0% |
| Immigrants | Caribbean | 0.0 /100 | #331 | Tragic 19.6% |
| Pueblo | 0.0 /100 | #332 | Tragic 19.9% |
| Inupiat | 0.0 /100 | #333 | Tragic 20.1% |
| Yuman | 0.0 /100 | #334 | Tragic 20.2% |
| Immigrants | Cuba | 0.0 /100 | #335 | Tragic 20.8% |
| Navajo | 0.0 /100 | #336 | Tragic 21.1% |
Demographics Similar to Swedes by Receiving Food Stamps
In terms of receiving food stamps, the demographic groups most similar to Swedes are Immigrants from Ireland (9.2%, a difference of 0.20%), Bhutanese (9.2%, a difference of 0.24%), Czech (9.2%, a difference of 0.25%), Immigrants from Northern Europe (9.2%, a difference of 0.30%), and Eastern European (9.2%, a difference of 0.32%).
| Demographics | Rating | Rank | Receiving Food Stamps |
| Immigrants | Hong Kong | 99.8 /100 | #19 | Exceptional 9.1% |
| Latvians | 99.8 /100 | #20 | Exceptional 9.1% |
| Luxembourgers | 99.8 /100 | #21 | Exceptional 9.1% |
| Immigrants | Australia | 99.8 /100 | #22 | Exceptional 9.2% |
| Eastern Europeans | 99.8 /100 | #23 | Exceptional 9.2% |
| Immigrants | Northern Europe | 99.8 /100 | #24 | Exceptional 9.2% |
| Immigrants | Ireland | 99.8 /100 | #25 | Exceptional 9.2% |
| Swedes | 99.8 /100 | #26 | Exceptional 9.2% |
| Bhutanese | 99.8 /100 | #27 | Exceptional 9.2% |
| Czechs | 99.8 /100 | #28 | Exceptional 9.2% |
| Immigrants | Lithuania | 99.8 /100 | #29 | Exceptional 9.2% |
| Immigrants | Sweden | 99.7 /100 | #30 | Exceptional 9.3% |
| Immigrants | Eastern Asia | 99.7 /100 | #31 | Exceptional 9.3% |
| Bolivians | 99.7 /100 | #32 | Exceptional 9.3% |
| Zimbabweans | 99.6 /100 | #33 | Exceptional 9.5% |