Immigrants from Cuba vs Sudanese Child Poverty Among Girls Under 16
COMPARE
Immigrants from Cuba
Sudanese
Child Poverty Among Girls Under 16
Child Poverty Among Girls Under 16 Comparison
Immigrants from Cuba
Sudanese
18.8%
CHILD POVERTY AMONG GIRLS UNDER 16
0.7/ 100
METRIC RATING
242nd/ 347
METRIC RANK
18.6%
CHILD POVERTY AMONG GIRLS UNDER 16
1.1/ 100
METRIC RATING
233rd/ 347
METRIC RANK
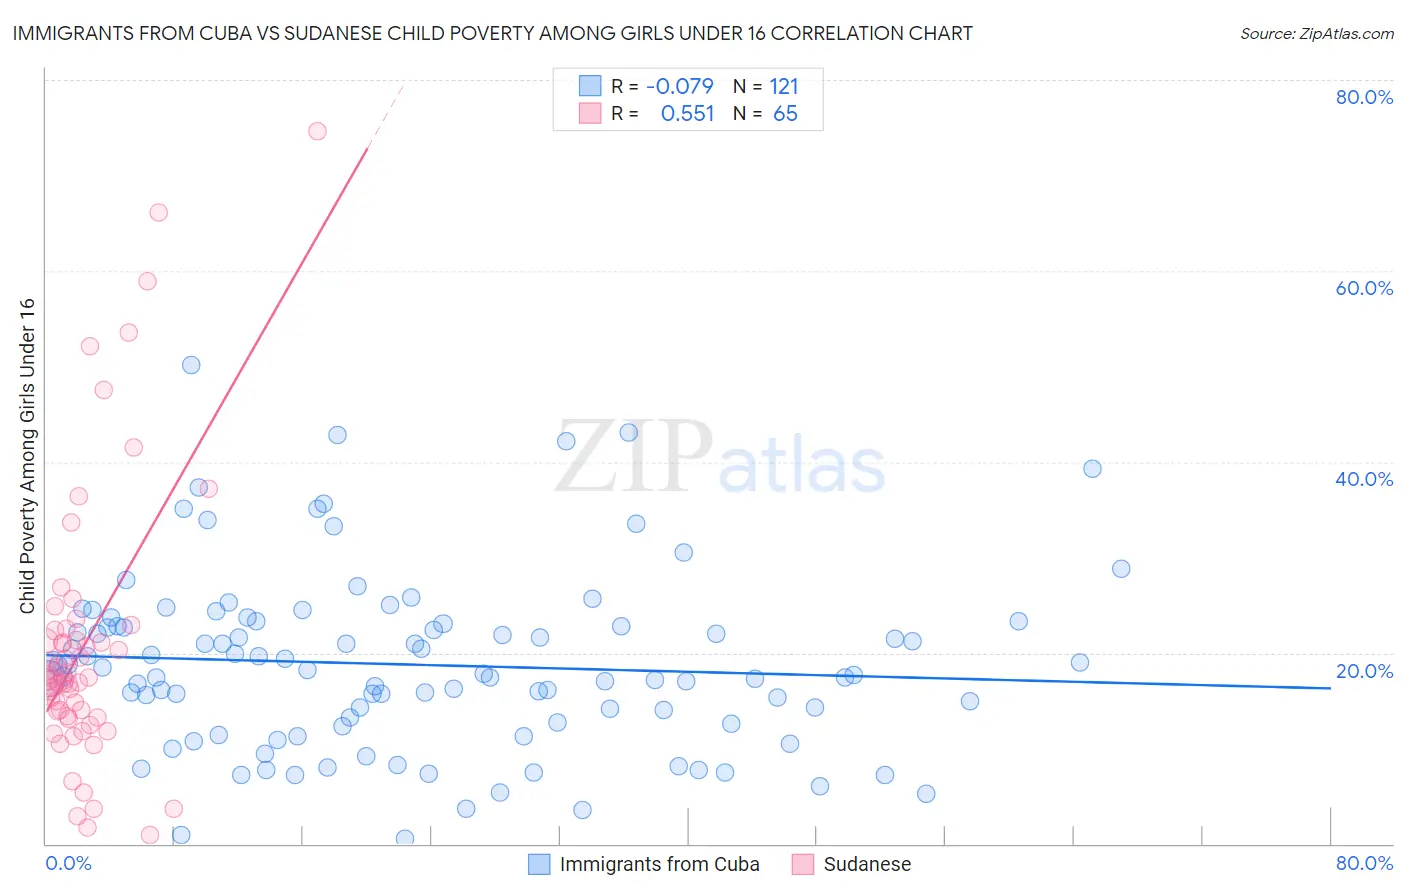
Immigrants from Cuba vs Sudanese Child Poverty Among Girls Under 16 Correlation Chart
The statistical analysis conducted on geographies consisting of 321,897,720 people shows a slight negative correlation between the proportion of Immigrants from Cuba and poverty level among girls under the age of 16 in the United States with a correlation coefficient (R) of -0.079 and weighted average of 18.8%. Similarly, the statistical analysis conducted on geographies consisting of 109,721,047 people shows a substantial positive correlation between the proportion of Sudanese and poverty level among girls under the age of 16 in the United States with a correlation coefficient (R) of 0.551 and weighted average of 18.6%, a difference of 1.1%.
Child Poverty Among Girls Under 16 Correlation Summary
| Measurement | Immigrants from Cuba | Sudanese |
| Minimum | 0.48% | 0.90% |
| Maximum | 50.1% | 74.6% |
| Range | 49.6% | 73.7% |
| Mean | 18.8% | 21.0% |
| Median | 17.8% | 17.3% |
| Interquartile 25% (IQ1) | 12.6% | 13.3% |
| Interquartile 75% (IQ3) | 22.9% | 22.4% |
| Interquartile Range (IQR) | 10.2% | 9.1% |
| Standard Deviation (Sample) | 9.2% | 14.7% |
| Standard Deviation (Population) | 9.1% | 14.5% |
Demographics Similar to Immigrants from Cuba and Sudanese by Child Poverty Among Girls Under 16
In terms of child poverty among girls under 16, the demographic groups most similar to Immigrants from Cuba are American (18.8%, a difference of 0.14%), Immigrants from Nicaragua (18.8%, a difference of 0.22%), Ecuadorian (18.8%, a difference of 0.28%), Shoshone (18.9%, a difference of 0.40%), and Immigrants from Laos (18.9%, a difference of 0.43%). Similarly, the demographic groups most similar to Sudanese are Immigrants from Sudan (18.6%, a difference of 0.040%), Fijian (18.6%, a difference of 0.070%), Nepalese (18.6%, a difference of 0.12%), Alsatian (18.6%, a difference of 0.13%), and Immigrants from Nigeria (18.6%, a difference of 0.26%).
| Demographics | Rating | Rank | Child Poverty Among Girls Under 16 |
| Immigrants | Nonimmigrants | 2.0 /100 | #227 | Tragic 18.3% |
| Alaskan Athabascans | 2.0 /100 | #228 | Tragic 18.3% |
| Ghanaians | 1.4 /100 | #229 | Tragic 18.5% |
| Osage | 1.3 /100 | #230 | Tragic 18.5% |
| Cree | 1.3 /100 | #231 | Tragic 18.5% |
| Immigrants | Sudan | 1.1 /100 | #232 | Tragic 18.6% |
| Sudanese | 1.1 /100 | #233 | Tragic 18.6% |
| Fijians | 1.1 /100 | #234 | Tragic 18.6% |
| Nepalese | 1.1 /100 | #235 | Tragic 18.6% |
| Alsatians | 1.1 /100 | #236 | Tragic 18.6% |
| Immigrants | Nigeria | 1.0 /100 | #237 | Tragic 18.6% |
| Immigrants | Eritrea | 1.0 /100 | #238 | Tragic 18.7% |
| Marshallese | 0.9 /100 | #239 | Tragic 18.7% |
| Nigerians | 0.9 /100 | #240 | Tragic 18.7% |
| Americans | 0.8 /100 | #241 | Tragic 18.8% |
| Immigrants | Cuba | 0.7 /100 | #242 | Tragic 18.8% |
| Immigrants | Nicaragua | 0.7 /100 | #243 | Tragic 18.8% |
| Ecuadorians | 0.7 /100 | #244 | Tragic 18.8% |
| Shoshone | 0.6 /100 | #245 | Tragic 18.9% |
| Immigrants | Laos | 0.6 /100 | #246 | Tragic 18.9% |
| Immigrants | Ghana | 0.5 /100 | #247 | Tragic 18.9% |