Immigrants from Croatia vs Sudanese Child Poverty Among Girls Under 16

COMPARE

Immigrants from Croatia
Race
Ancestry
AfghanAfricanAlaska NativeAlaskan AthabascanAlbanianAleutAlsatianAmericanApacheArabArapahoArgentineanArmenianAssyrian/Chaldean/SyriacAustralianAustrianBahamianBangladeshiBarbadianBasqueBelgianBelizeanBermudanBhutaneseBlackfeetBolivianBrazilianBritishBritish West IndianBulgarianBurmeseCajunCambodianCanadianCape VerdeanCarpatho RusynCelticCentral AmericanCentral American IndianCherokeeCheyenneChickasawChileanChineseChippewaChoctawColombianColvilleComancheCosta RicanCreeCreekCroatianCrowCubanCypriotCzechCzechoslovakianDanishDelawareDominicanDutchDutch West IndianEastern EuropeanEcuadorianEgyptianEnglishEstonianEthiopianEuropeanFijianFilipinoFinnishFrenchFrench American IndianFrench CanadianGermanGerman RussianGhanaianGreekGuamanian/ChamorroGuatemalanGuyaneseHaitianHmongHonduranHopiHoumaHungarianIcelanderIndian (Asian)IndonesianInupiatIranianIraqiIrishIroquoisIsraeliItalianJamaicanJapaneseJordanianKenyanKiowaKoreanLaotianLatvianLebaneseLiberianLithuanianLumbeeLuxembourgerMacedonianMalaysianMalteseMarshalleseMenomineeMexicanMexican American IndianMongolianMoroccanNative HawaiianNavajoNepaleseNew ZealanderNicaraguanNigerianNorthern EuropeanNorwegianOkinawanOsageOttawaPaiutePakistaniPalestinianPanamanianParaguayanPennsylvania GermanPeruvianPimaPolishPortuguesePotawatomiPuebloPuerto RicanPuget Sound SalishRomanianRussianSalvadoranSamoanScandinavianScotch-IrishScottishSeminoleSenegaleseSerbianShoshoneSierra LeoneanSiouxSlavicSlovakSloveneSomaliSouth AfricanSouth AmericanSouth American IndianSoviet UnionSpaniardSpanishSpanish AmericanSpanish American IndianSri LankanSubsaharan AfricanSwedishSwissSyrianTaiwaneseThaiTlingit-HaidaTohono O'OdhamTonganTrinidadian and TobagonianTsimshianTurkishU.S. Virgin IslanderUgandanUkrainianUruguayanUteVenezuelanVietnameseWelshWest IndianYakamaYaquiYugoslavianYumanYup'ikZimbabwean
Immigration
NonimmigrantsImmigrantsAfghanistanAfricaAlbaniaArgentinaArmeniaAsiaAustraliaAustriaBahamasBangladeshBarbadosBelarusBelgiumBelizeBoliviaBosnia and HerzegovinaBrazilBulgariaBurma/MyanmarCabo VerdeCambodiaCameroonCanadaCaribbeanCentral AmericaChileChinaColombiaCongoCosta RicaCroatiaCubaCzechoslovakiaDenmarkDominicaDominican RepublicEastern AfricaEastern AsiaEastern EuropeEcuadorEgyptEl SalvadorEnglandEritreaEthiopiaEuropeFijiFranceGermanyGhanaGreeceGrenadaGuatemalaGuyanaHaitiHondurasHong KongHungaryIndiaIndonesiaIranIraqIrelandIsraelItalyJamaicaJapanJordanKazakhstanKenyaKoreaKuwaitLaosLatin AmericaLatviaLebanonLiberiaLithuaniaMalaysiaMexicoMicronesiaMiddle AfricaMoldovaMoroccoNepalNetherlandsNicaraguaNigeriaNorth AmericaNorth MacedoniaNorthern AfricaNorthern EuropeNorwayOceaniaPakistanPanamaPeruPhilippinesPolandPortugalRomaniaRussiaSaudi ArabiaScotlandSenegalSerbiaSierra LeoneSingaporeSomaliaSouth AfricaSouth AmericaSouth Central AsiaSouth Eastern AsiaSouthern EuropeSpainSri LankaSt. Vincent and the GrenadinesSudanSwedenSwitzerlandSyriaTaiwanThailandTrinidad and TobagoTurkeyUgandaUkraineUruguayUzbekistanVenezuelaVietnamWest IndiesWestern AfricaWestern AsiaWestern EuropeYemenZaireZimbabweAzores
Sudanese
Race
Ancestry
AfghanAfricanAlaska NativeAlaskan AthabascanAlbanianAleutAlsatianAmericanApacheArabArapahoArgentineanArmenianAssyrian/Chaldean/SyriacAustralianAustrianBahamianBangladeshiBarbadianBasqueBelgianBelizeanBermudanBhutaneseBlackfeetBolivianBrazilianBritishBritish West IndianBulgarianBurmeseCajunCambodianCanadianCape VerdeanCarpatho RusynCelticCentral AmericanCentral American IndianCherokeeCheyenneChickasawChileanChineseChippewaChoctawColombianColvilleComancheCosta RicanCreeCreekCroatianCrowCubanCypriotCzechCzechoslovakianDanishDelawareDominicanDutchDutch West IndianEastern EuropeanEcuadorianEgyptianEnglishEstonianEthiopianEuropeanFijianFilipinoFinnishFrenchFrench American IndianFrench CanadianGermanGerman RussianGhanaianGreekGuamanian/ChamorroGuatemalanGuyaneseHaitianHmongHonduranHopiHoumaHungarianIcelanderIndian (Asian)IndonesianInupiatIranianIraqiIrishIroquoisIsraeliItalianJamaicanJapaneseJordanianKenyanKiowaKoreanLaotianLatvianLebaneseLiberianLithuanianLumbeeLuxembourgerMacedonianMalaysianMalteseMarshalleseMenomineeMexicanMexican American IndianMongolianMoroccanNative HawaiianNavajoNepaleseNew ZealanderNicaraguanNigerianNorthern EuropeanNorwegianOkinawanOsageOttawaPaiutePakistaniPalestinianPanamanianParaguayanPennsylvania GermanPeruvianPimaPolishPortuguesePotawatomiPuebloPuerto RicanPuget Sound SalishRomanianRussianSalvadoranSamoanScandinavianScotch-IrishScottishSeminoleSenegaleseSerbianShoshoneSierra LeoneanSiouxSlavicSlovakSloveneSomaliSouth AfricanSouth AmericanSouth American IndianSoviet UnionSpaniardSpanishSpanish AmericanSpanish American IndianSri LankanSubsaharan AfricanSudaneseSwedishSwissSyrianTaiwaneseThaiTlingit-HaidaTohono O'OdhamTonganTrinidadian and TobagonianTsimshianTurkishU.S. Virgin IslanderUgandanUkrainianUruguayanUteVenezuelanVietnameseWelshWest IndianYakamaYaquiYugoslavianYumanYup'ikZimbabwean
Immigration
NonimmigrantsImmigrantsAfghanistanAfricaAlbaniaArgentinaArmeniaAsiaAustraliaAustriaBahamasBangladeshBarbadosBelarusBelgiumBelizeBoliviaBosnia and HerzegovinaBrazilBulgariaBurma/MyanmarCabo VerdeCambodiaCameroonCanadaCaribbeanCentral AmericaChileChinaColombiaCongoCosta RicaCubaCzechoslovakiaDenmarkDominicaDominican RepublicEastern AfricaEastern AsiaEastern EuropeEcuadorEgyptEl SalvadorEnglandEritreaEthiopiaEuropeFijiFranceGermanyGhanaGreeceGrenadaGuatemalaGuyanaHaitiHondurasHong KongHungaryIndiaIndonesiaIranIraqIrelandIsraelItalyJamaicaJapanJordanKazakhstanKenyaKoreaKuwaitLaosLatin AmericaLatviaLebanonLiberiaLithuaniaMalaysiaMexicoMicronesiaMiddle AfricaMoldovaMoroccoNepalNetherlandsNicaraguaNigeriaNorth AmericaNorth MacedoniaNorthern AfricaNorthern EuropeNorwayOceaniaPakistanPanamaPeruPhilippinesPolandPortugalRomaniaRussiaSaudi ArabiaScotlandSenegalSerbiaSierra LeoneSingaporeSomaliaSouth AfricaSouth AmericaSouth Central AsiaSouth Eastern AsiaSouthern EuropeSpainSri LankaSt. Vincent and the GrenadinesSudanSwedenSwitzerlandSyriaTaiwanThailandTrinidad and TobagoTurkeyUgandaUkraineUruguayUzbekistanVenezuelaVietnamWest IndiesWestern AfricaWestern AsiaWestern EuropeYemenZaireZimbabweAzores
Child Poverty Among Girls Under 16
Income
Poverty
Unemployment
Labor Participation
Family Structure
Vehicle Availability
Education Level
Disability

Child Poverty Among Girls Under 16 Comparison

Immigrants from Croatia

Sudanese

Exceptional
Tragic
15.1%
CHILD POVERTY AMONG GIRLS UNDER 16
94.6/ 100
METRIC RATING
110th/ 347
METRIC RANK
18.6%
CHILD POVERTY AMONG GIRLS UNDER 16
1.1/ 100
METRIC RATING
233rd/ 347
METRIC RANK

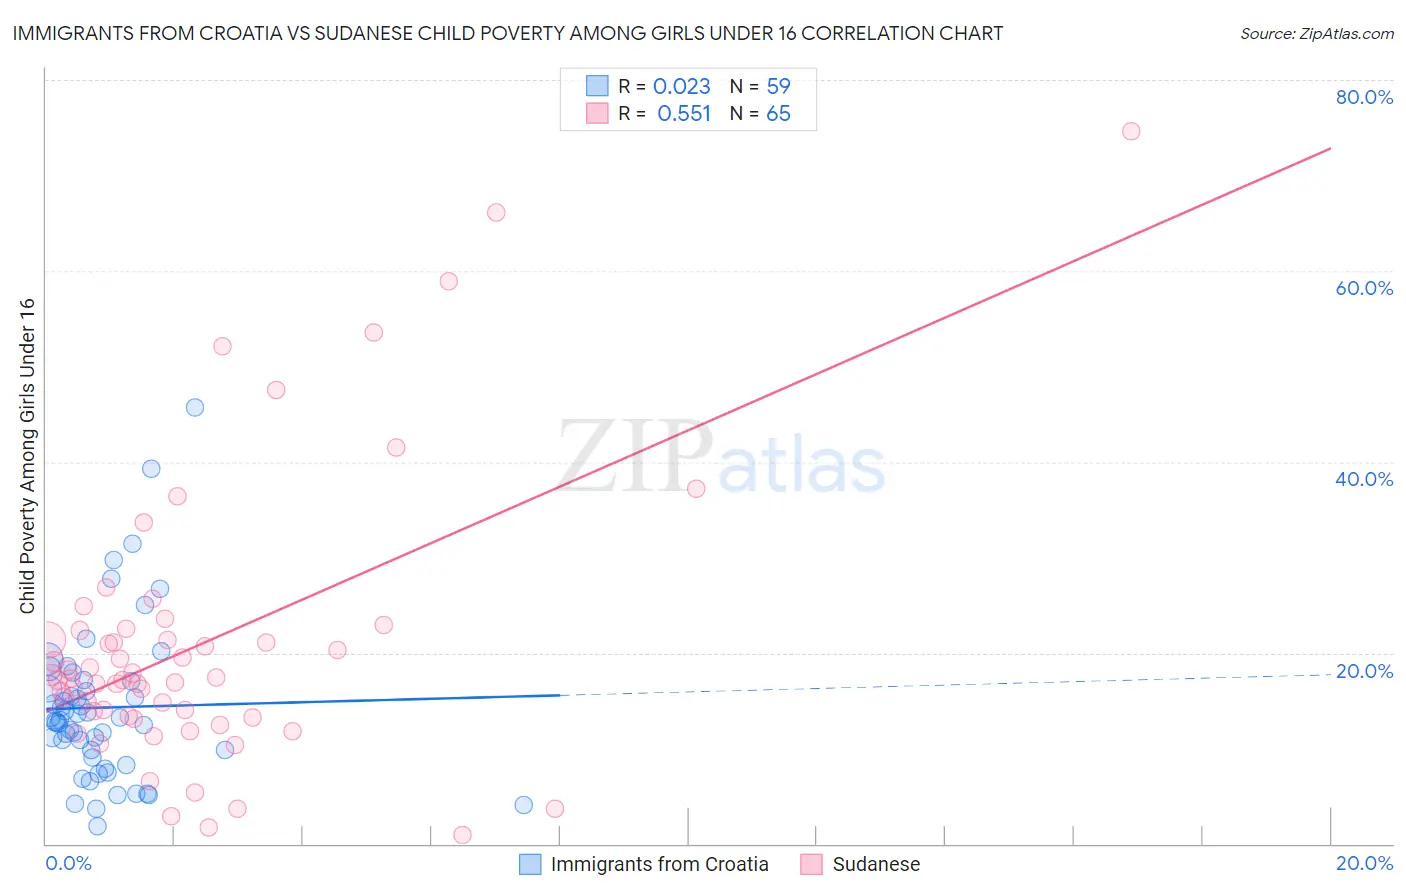
Immigrants from Croatia vs Sudanese Child Poverty Among Girls Under 16 Correlation Chart

The statistical analysis conducted on geographies consisting of 131,350,096 people shows no correlation between the proportion of Immigrants from Croatia and poverty level among girls under the age of 16 in the United States with a correlation coefficient (R) of 0.023 and weighted average of 15.1%. Similarly, the statistical analysis conducted on geographies consisting of 109,721,047 people shows a substantial positive correlation between the proportion of Sudanese and poverty level among girls under the age of 16 in the United States with a correlation coefficient (R) of 0.551 and weighted average of 18.6%, a difference of 23.0%.
Immigrants from Croatia vs Sudanese Child Poverty Among Girls Under 16

Child Poverty Among Girls Under 16 Correlation Summary

MeasurementImmigrants from CroatiaSudanese
Minimum1.9%0.90%
Maximum45.7%74.6%
Range43.8%73.7%
Mean14.3%21.0%
Median13.0%17.3%
Interquartile 25% (IQ1)9.1%13.3%
Interquartile 75% (IQ3)17.0%22.4%
Interquartile Range (IQR)7.9%9.1%
Standard Deviation (Sample)8.3%14.7%
Standard Deviation (Population)8.3%14.5%

Similar Demographics by Child Poverty Among Girls Under 16

Demographics Similar to Immigrants from Croatia by Child Poverty Among Girls Under 16

In terms of child poverty among girls under 16, the demographic groups most similar to Immigrants from Croatia are Palestinian (15.1%, a difference of 0.040%), Serbian (15.1%, a difference of 0.12%), Immigrants from Kazakhstan (15.1%, a difference of 0.19%), Immigrants from Brazil (15.1%, a difference of 0.20%), and Dutch (15.1%, a difference of 0.20%).
DemographicsRating | RankChild Poverty Among Girls Under 16
British
95.6
/100
|
#103
Exceptional
15.0%
Romanians
95.3
/100
|
#104
Exceptional
15.0%
Immigrants | England
95.1
/100
|
#105
Exceptional
15.1%
Chileans
95.1
/100
|
#106
Exceptional
15.1%
Immigrants | Ukraine
95.0
/100
|
#107
Exceptional
15.1%
Immigrants | Brazil
94.9
/100
|
#108
Exceptional
15.1%
Serbians
94.8
/100
|
#109
Exceptional
15.1%
Immigrants | Croatia
94.6
/100
|
#110
Exceptional
15.1%
Palestinians
94.5
/100
|
#111
Exceptional
15.1%
Immigrants | Kazakhstan
94.3
/100
|
#112
Exceptional
15.1%
Dutch
94.3
/100
|
#113
Exceptional
15.1%
Sri Lankans
94.0
/100
|
#114
Exceptional
15.2%
Belgians
93.9
/100
|
#115
Exceptional
15.2%
Immigrants | Denmark
93.3
/100
|
#116
Exceptional
15.2%
Immigrants | North Macedonia
93.1
/100
|
#117
Exceptional
15.2%

Demographics Similar to Sudanese by Child Poverty Among Girls Under 16

In terms of child poverty among girls under 16, the demographic groups most similar to Sudanese are Immigrants from Sudan (18.6%, a difference of 0.040%), Fijian (18.6%, a difference of 0.070%), Nepalese (18.6%, a difference of 0.12%), Alsatian (18.6%, a difference of 0.13%), and Immigrants from Nigeria (18.6%, a difference of 0.26%).
DemographicsRating | RankChild Poverty Among Girls Under 16
Nicaraguans
2.4
/100
|
#226
Tragic
18.2%
Immigrants | Nonimmigrants
2.0
/100
|
#227
Tragic
18.3%
Alaskan Athabascans
2.0
/100
|
#228
Tragic
18.3%
Ghanaians
1.4
/100
|
#229
Tragic
18.5%
Osage
1.3
/100
|
#230
Tragic
18.5%
Cree
1.3
/100
|
#231
Tragic
18.5%
Immigrants | Sudan
1.1
/100
|
#232
Tragic
18.6%
Sudanese
1.1
/100
|
#233
Tragic
18.6%
Fijians
1.1
/100
|
#234
Tragic
18.6%
Nepalese
1.1
/100
|
#235
Tragic
18.6%
Alsatians
1.1
/100
|
#236
Tragic
18.6%
Immigrants | Nigeria
1.0
/100
|
#237
Tragic
18.6%
Immigrants | Eritrea
1.0
/100
|
#238
Tragic
18.7%
Marshallese
0.9
/100
|
#239
Tragic
18.7%
Nigerians
0.9
/100
|
#240
Tragic
18.7%