Immigrants from Costa Rica vs Nonimmigrants Family Poverty
COMPARE
Immigrants from Costa Rica
Nonimmigrants
Family Poverty
Family Poverty Comparison
Immigrants from Costa Rica
Nonimmigrants
9.4%
FAMILY POVERTY
21.7/ 100
METRIC RATING
200th/ 347
METRIC RANK
9.8%
FAMILY POVERTY
6.7/ 100
METRIC RATING
215th/ 347
METRIC RANK
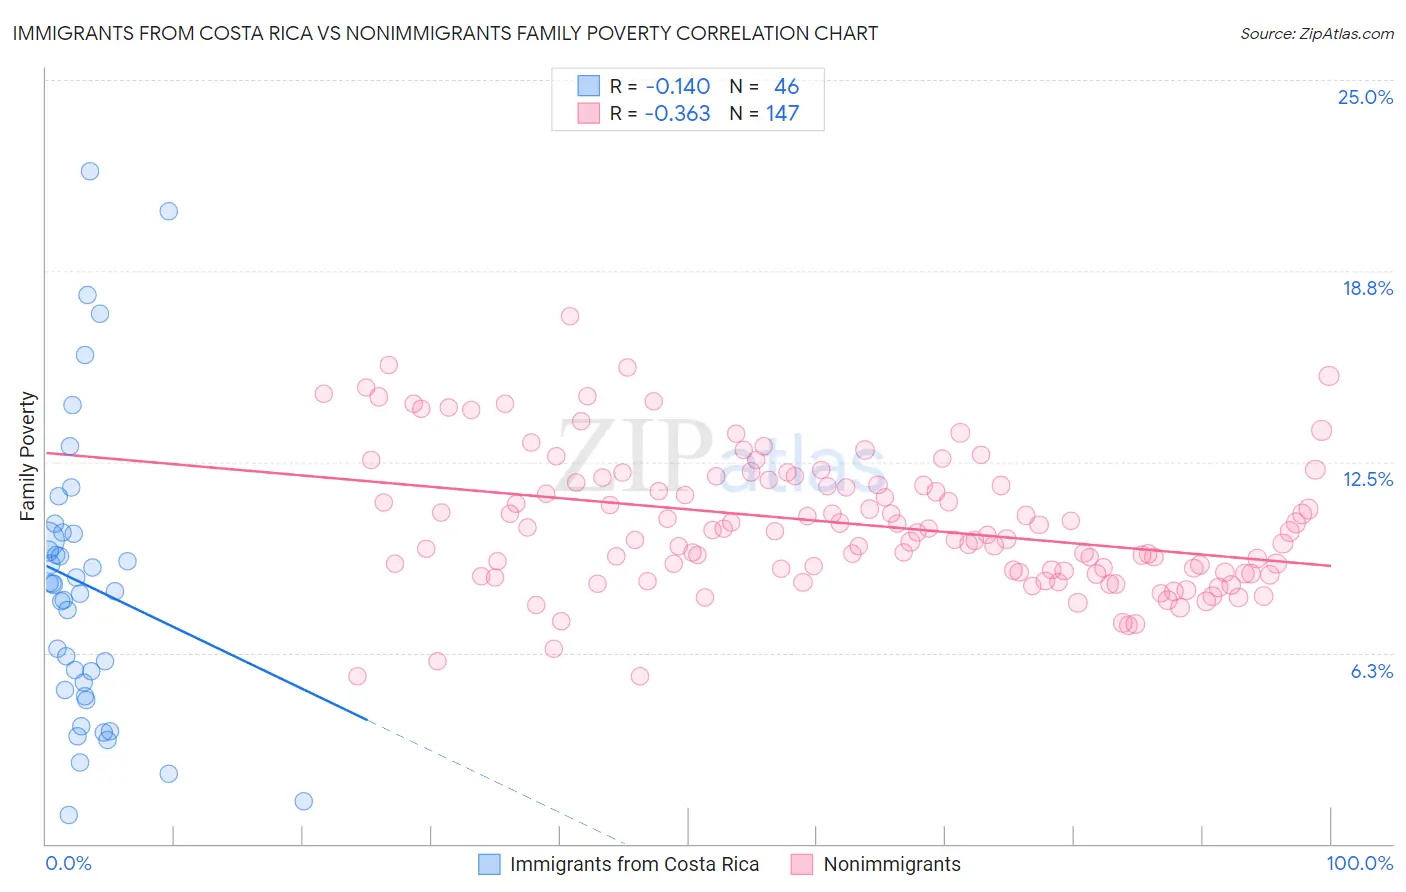
Immigrants from Costa Rica vs Nonimmigrants Family Poverty Correlation Chart
The statistical analysis conducted on geographies consisting of 204,115,485 people shows a poor negative correlation between the proportion of Immigrants from Costa Rica and poverty level among families in the United States with a correlation coefficient (R) of -0.140 and weighted average of 9.4%. Similarly, the statistical analysis conducted on geographies consisting of 578,873,352 people shows a mild negative correlation between the proportion of Nonimmigrants and poverty level among families in the United States with a correlation coefficient (R) of -0.363 and weighted average of 9.8%, a difference of 4.3%.
Family Poverty Correlation Summary
| Measurement | Immigrants from Costa Rica | Nonimmigrants |
| Minimum | 0.92% | 5.5% |
| Maximum | 22.0% | 17.3% |
| Range | 21.1% | 11.8% |
| Mean | 8.5% | 10.5% |
| Median | 8.4% | 10.2% |
| Interquartile 25% (IQ1) | 5.0% | 8.9% |
| Interquartile 75% (IQ3) | 10.2% | 11.8% |
| Interquartile Range (IQR) | 5.1% | 3.0% |
| Standard Deviation (Sample) | 4.8% | 2.2% |
| Standard Deviation (Population) | 4.7% | 2.2% |
Demographics Similar to Immigrants from Costa Rica and Nonimmigrants by Family Poverty
In terms of family poverty, the demographic groups most similar to Immigrants from Costa Rica are Spaniard (9.4%, a difference of 0.19%), Immigrants from Portugal (9.4%, a difference of 0.23%), Immigrants from Sierra Leone (9.4%, a difference of 0.40%), Iraqi (9.3%, a difference of 0.44%), and German Russian (9.4%, a difference of 0.44%). Similarly, the demographic groups most similar to Nonimmigrants are Immigrants from Micronesia (9.8%, a difference of 0.030%), Moroccan (9.8%, a difference of 0.060%), American (9.8%, a difference of 0.26%), Osage (9.7%, a difference of 0.61%), and Immigrants from Thailand (9.7%, a difference of 1.2%).
| Demographics | Rating | Rank | Family Poverty |
| Immigrants | Colombia | 24.4 /100 | #197 | Fair 9.3% |
| Iraqis | 24.2 /100 | #198 | Fair 9.3% |
| Spaniards | 22.8 /100 | #199 | Fair 9.4% |
| Immigrants | Costa Rica | 21.7 /100 | #200 | Fair 9.4% |
| Immigrants | Portugal | 20.5 /100 | #201 | Fair 9.4% |
| Immigrants | Sierra Leone | 19.6 /100 | #202 | Poor 9.4% |
| German Russians | 19.4 /100 | #203 | Poor 9.4% |
| Immigrants | Lebanon | 18.9 /100 | #204 | Poor 9.4% |
| Aleuts | 18.0 /100 | #205 | Poor 9.5% |
| Immigrants | South America | 18.0 /100 | #206 | Poor 9.5% |
| Sierra Leoneans | 15.6 /100 | #207 | Poor 9.5% |
| Immigrants | Eastern Africa | 15.1 /100 | #208 | Poor 9.5% |
| Immigrants | Uruguay | 14.0 /100 | #209 | Poor 9.5% |
| Alsatians | 11.3 /100 | #210 | Poor 9.6% |
| Malaysians | 10.6 /100 | #211 | Poor 9.6% |
| Immigrants | Thailand | 9.7 /100 | #212 | Tragic 9.7% |
| Osage | 8.0 /100 | #213 | Tragic 9.7% |
| Immigrants | Micronesia | 6.7 /100 | #214 | Tragic 9.8% |
| Immigrants | Nonimmigrants | 6.7 /100 | #215 | Tragic 9.8% |
| Moroccans | 6.5 /100 | #216 | Tragic 9.8% |
| Americans | 6.2 /100 | #217 | Tragic 9.8% |