Belizean vs Nonimmigrants Family Poverty
COMPARE
Belizean
Nonimmigrants
Family Poverty
Family Poverty Comparison
Belizeans
Nonimmigrants
11.3%
FAMILY POVERTY
0.0/ 100
METRIC RATING
280th/ 347
METRIC RANK
9.8%
FAMILY POVERTY
6.7/ 100
METRIC RATING
215th/ 347
METRIC RANK
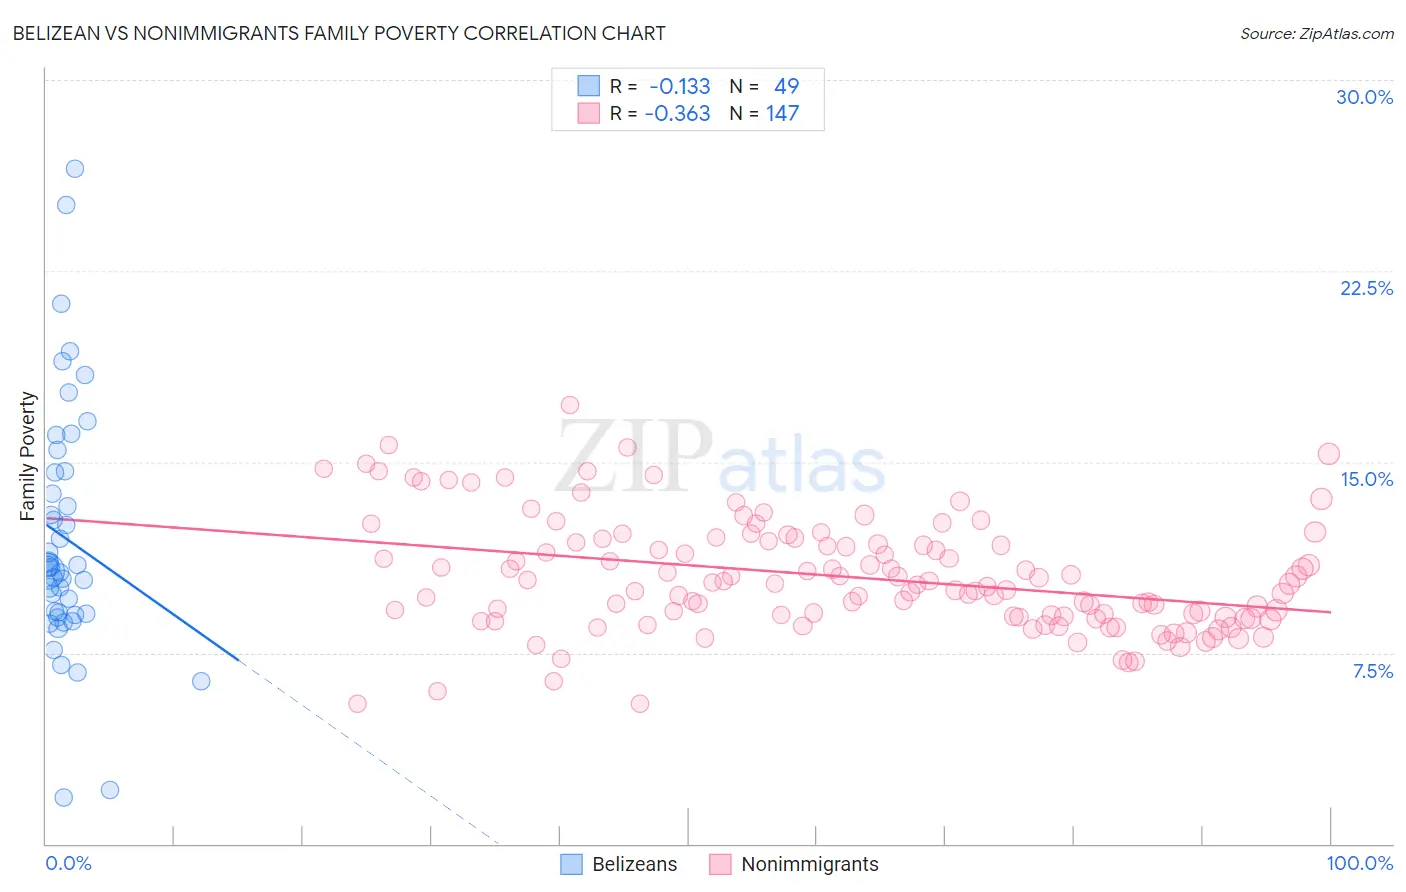
Belizean vs Nonimmigrants Family Poverty Correlation Chart
The statistical analysis conducted on geographies consisting of 144,106,447 people shows a poor negative correlation between the proportion of Belizeans and poverty level among families in the United States with a correlation coefficient (R) of -0.133 and weighted average of 11.3%. Similarly, the statistical analysis conducted on geographies consisting of 578,873,352 people shows a mild negative correlation between the proportion of Nonimmigrants and poverty level among families in the United States with a correlation coefficient (R) of -0.363 and weighted average of 9.8%, a difference of 15.1%.
Family Poverty Correlation Summary
| Measurement | Belizean | Nonimmigrants |
| Minimum | 1.8% | 5.5% |
| Maximum | 26.5% | 17.3% |
| Range | 24.7% | 11.8% |
| Mean | 12.0% | 10.5% |
| Median | 10.8% | 10.2% |
| Interquartile 25% (IQ1) | 9.0% | 8.9% |
| Interquartile 75% (IQ3) | 14.6% | 11.8% |
| Interquartile Range (IQR) | 5.6% | 3.0% |
| Standard Deviation (Sample) | 4.9% | 2.2% |
| Standard Deviation (Population) | 4.9% | 2.2% |
Similar Demographics by Family Poverty
Demographics Similar to Belizeans by Family Poverty
In terms of family poverty, the demographic groups most similar to Belizeans are Blackfeet (11.3%, a difference of 0.040%), Guyanese (11.2%, a difference of 0.18%), Chippewa (11.2%, a difference of 0.21%), Immigrants from West Indies (11.3%, a difference of 0.27%), and Immigrants from Guyana (11.2%, a difference of 0.30%).
| Demographics | Rating | Rank | Family Poverty |
| Somalis | 0.1 /100 | #273 | Tragic 11.2% |
| Spanish Americans | 0.1 /100 | #274 | Tragic 11.2% |
| Central Americans | 0.1 /100 | #275 | Tragic 11.2% |
| Immigrants | Guyana | 0.1 /100 | #276 | Tragic 11.2% |
| Chippewa | 0.1 /100 | #277 | Tragic 11.2% |
| Guyanese | 0.1 /100 | #278 | Tragic 11.2% |
| Blackfeet | 0.0 /100 | #279 | Tragic 11.3% |
| Belizeans | 0.0 /100 | #280 | Tragic 11.3% |
| Immigrants | West Indies | 0.0 /100 | #281 | Tragic 11.3% |
| Immigrants | Cuba | 0.0 /100 | #282 | Tragic 11.3% |
| Indonesians | 0.0 /100 | #283 | Tragic 11.3% |
| Yaqui | 0.0 /100 | #284 | Tragic 11.3% |
| Barbadians | 0.0 /100 | #285 | Tragic 11.3% |
| Senegalese | 0.0 /100 | #286 | Tragic 11.5% |
| Vietnamese | 0.0 /100 | #287 | Tragic 11.5% |
Demographics Similar to Nonimmigrants by Family Poverty
In terms of family poverty, the demographic groups most similar to Nonimmigrants are Immigrants from Micronesia (9.8%, a difference of 0.030%), Moroccan (9.8%, a difference of 0.060%), American (9.8%, a difference of 0.26%), Panamanian (9.8%, a difference of 0.58%), and Osage (9.7%, a difference of 0.61%).
| Demographics | Rating | Rank | Family Poverty |
| Immigrants | Eastern Africa | 15.1 /100 | #208 | Poor 9.5% |
| Immigrants | Uruguay | 14.0 /100 | #209 | Poor 9.5% |
| Alsatians | 11.3 /100 | #210 | Poor 9.6% |
| Malaysians | 10.6 /100 | #211 | Poor 9.6% |
| Immigrants | Thailand | 9.7 /100 | #212 | Tragic 9.7% |
| Osage | 8.0 /100 | #213 | Tragic 9.7% |
| Immigrants | Micronesia | 6.7 /100 | #214 | Tragic 9.8% |
| Immigrants | Nonimmigrants | 6.7 /100 | #215 | Tragic 9.8% |
| Moroccans | 6.5 /100 | #216 | Tragic 9.8% |
| Americans | 6.2 /100 | #217 | Tragic 9.8% |
| Panamanians | 5.6 /100 | #218 | Tragic 9.8% |
| Immigrants | Eritrea | 5.4 /100 | #219 | Tragic 9.9% |
| Bermudans | 5.3 /100 | #220 | Tragic 9.9% |
| Immigrants | Cambodia | 4.8 /100 | #221 | Tragic 9.9% |
| Japanese | 4.8 /100 | #222 | Tragic 9.9% |