Immigrants from China vs Immigrants from South Africa Poverty
COMPARE
Immigrants from China
Immigrants from South Africa
Poverty
Poverty Comparison
Immigrants from China
Immigrants from South Africa
11.6%
POVERTY
90.7/ 100
METRIC RATING
114th/ 347
METRIC RANK
11.5%
POVERTY
94.7/ 100
METRIC RATING
96th/ 347
METRIC RANK
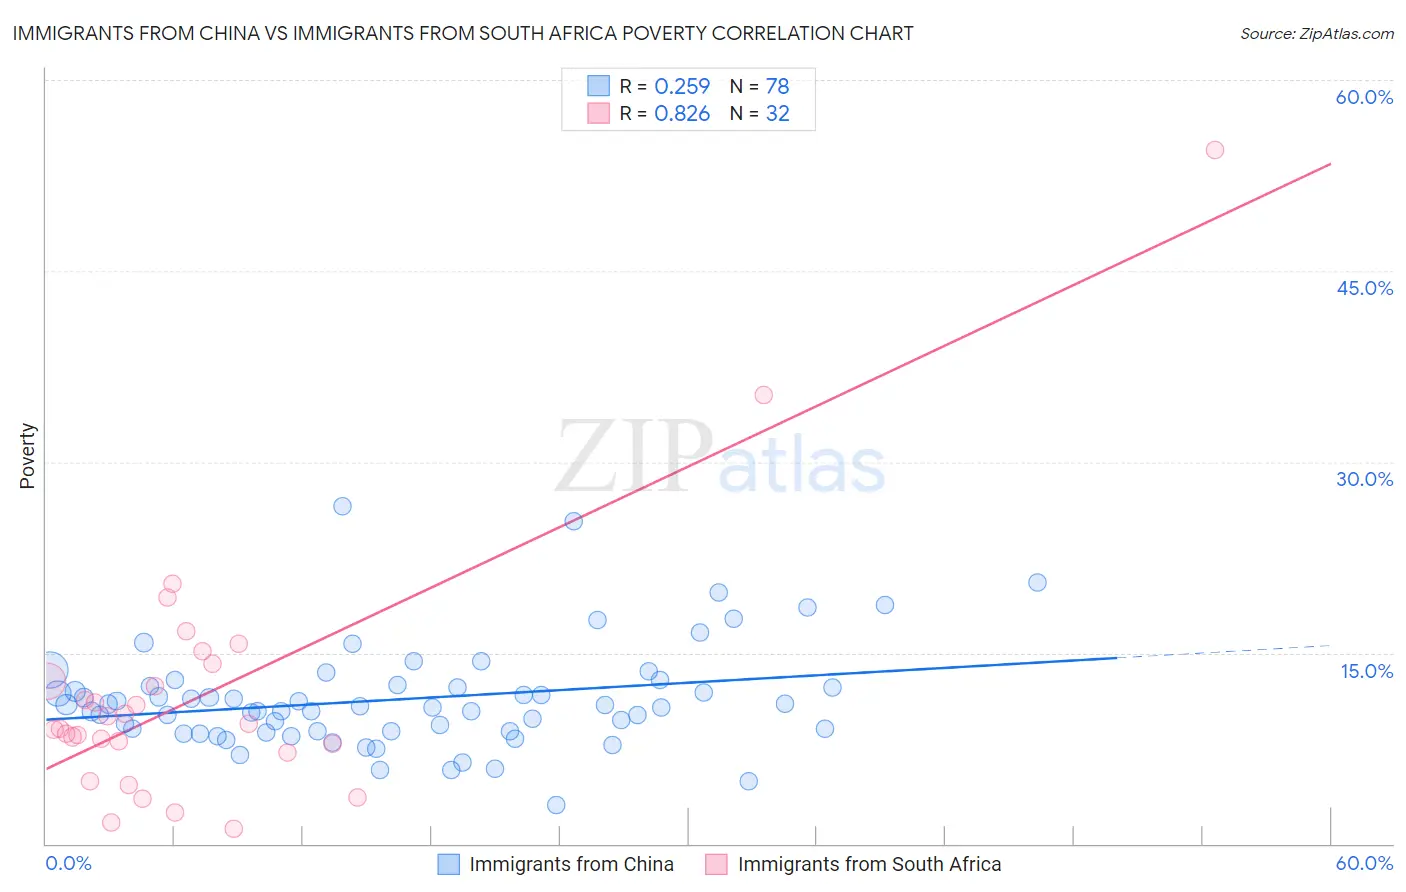
Immigrants from China vs Immigrants from South Africa Poverty Correlation Chart
The statistical analysis conducted on geographies consisting of 456,587,979 people shows a weak positive correlation between the proportion of Immigrants from China and poverty level in the United States with a correlation coefficient (R) of 0.259 and weighted average of 11.6%. Similarly, the statistical analysis conducted on geographies consisting of 233,262,094 people shows a very strong positive correlation between the proportion of Immigrants from South Africa and poverty level in the United States with a correlation coefficient (R) of 0.826 and weighted average of 11.5%, a difference of 1.5%.
Poverty Correlation Summary
| Measurement | Immigrants from China | Immigrants from South Africa |
| Minimum | 3.0% | 1.2% |
| Maximum | 26.5% | 54.5% |
| Range | 23.5% | 53.4% |
| Mean | 11.4% | 11.8% |
| Median | 10.8% | 9.3% |
| Interquartile 25% (IQ1) | 8.8% | 7.5% |
| Interquartile 75% (IQ3) | 12.3% | 13.4% |
| Interquartile Range (IQR) | 3.5% | 5.9% |
| Standard Deviation (Sample) | 4.1% | 10.2% |
| Standard Deviation (Population) | 4.1% | 10.0% |
Demographics Similar to Immigrants from China and Immigrants from South Africa by Poverty
In terms of poverty, the demographic groups most similar to Immigrants from China are Immigrants from Southern Europe (11.6%, a difference of 0.020%), Immigrants from Belarus (11.6%, a difference of 0.020%), French Canadian (11.6%, a difference of 0.090%), Albanian (11.7%, a difference of 0.14%), and Welsh (11.6%, a difference of 0.26%). Similarly, the demographic groups most similar to Immigrants from South Africa are Immigrants from Egypt (11.5%, a difference of 0.030%), Immigrants from Latvia (11.5%, a difference of 0.070%), Australian (11.4%, a difference of 0.12%), Immigrants from Indonesia (11.5%, a difference of 0.20%), and Scottish (11.5%, a difference of 0.31%).
| Demographics | Rating | Rank | Poverty |
| Australians | 94.9 /100 | #95 | Exceptional 11.4% |
| Immigrants | South Africa | 94.7 /100 | #96 | Exceptional 11.5% |
| Immigrants | Egypt | 94.6 /100 | #97 | Exceptional 11.5% |
| Immigrants | Latvia | 94.5 /100 | #98 | Exceptional 11.5% |
| Immigrants | Indonesia | 94.2 /100 | #99 | Exceptional 11.5% |
| Scottish | 94.0 /100 | #100 | Exceptional 11.5% |
| Slavs | 93.3 /100 | #101 | Exceptional 11.5% |
| Laotians | 92.4 /100 | #102 | Exceptional 11.6% |
| Okinawans | 92.4 /100 | #103 | Exceptional 11.6% |
| Native Hawaiians | 92.1 /100 | #104 | Exceptional 11.6% |
| Portuguese | 92.1 /100 | #105 | Exceptional 11.6% |
| Immigrants | Zimbabwe | 92.1 /100 | #106 | Exceptional 11.6% |
| Palestinians | 91.8 /100 | #107 | Exceptional 11.6% |
| Canadians | 91.7 /100 | #108 | Exceptional 11.6% |
| Immigrants | Turkey | 91.7 /100 | #109 | Exceptional 11.6% |
| Welsh | 91.6 /100 | #110 | Exceptional 11.6% |
| French Canadians | 91.0 /100 | #111 | Exceptional 11.6% |
| Immigrants | Southern Europe | 90.8 /100 | #112 | Exceptional 11.6% |
| Immigrants | Belarus | 90.8 /100 | #113 | Exceptional 11.6% |
| Immigrants | China | 90.7 /100 | #114 | Exceptional 11.6% |
| Albanians | 90.3 /100 | #115 | Exceptional 11.7% |