Immigrants from Chile vs Welsh Married-couple Households
COMPARE
Immigrants from Chile
Welsh
Married-couple Households
Married-couple Households Comparison
Immigrants from Chile
Welsh
46.5%
MARRIED-COUPLE HOUSEHOLDS
55.7/ 100
METRIC RATING
171st/ 347
METRIC RANK
48.8%
MARRIED-COUPLE HOUSEHOLDS
99.5/ 100
METRIC RATING
44th/ 347
METRIC RANK
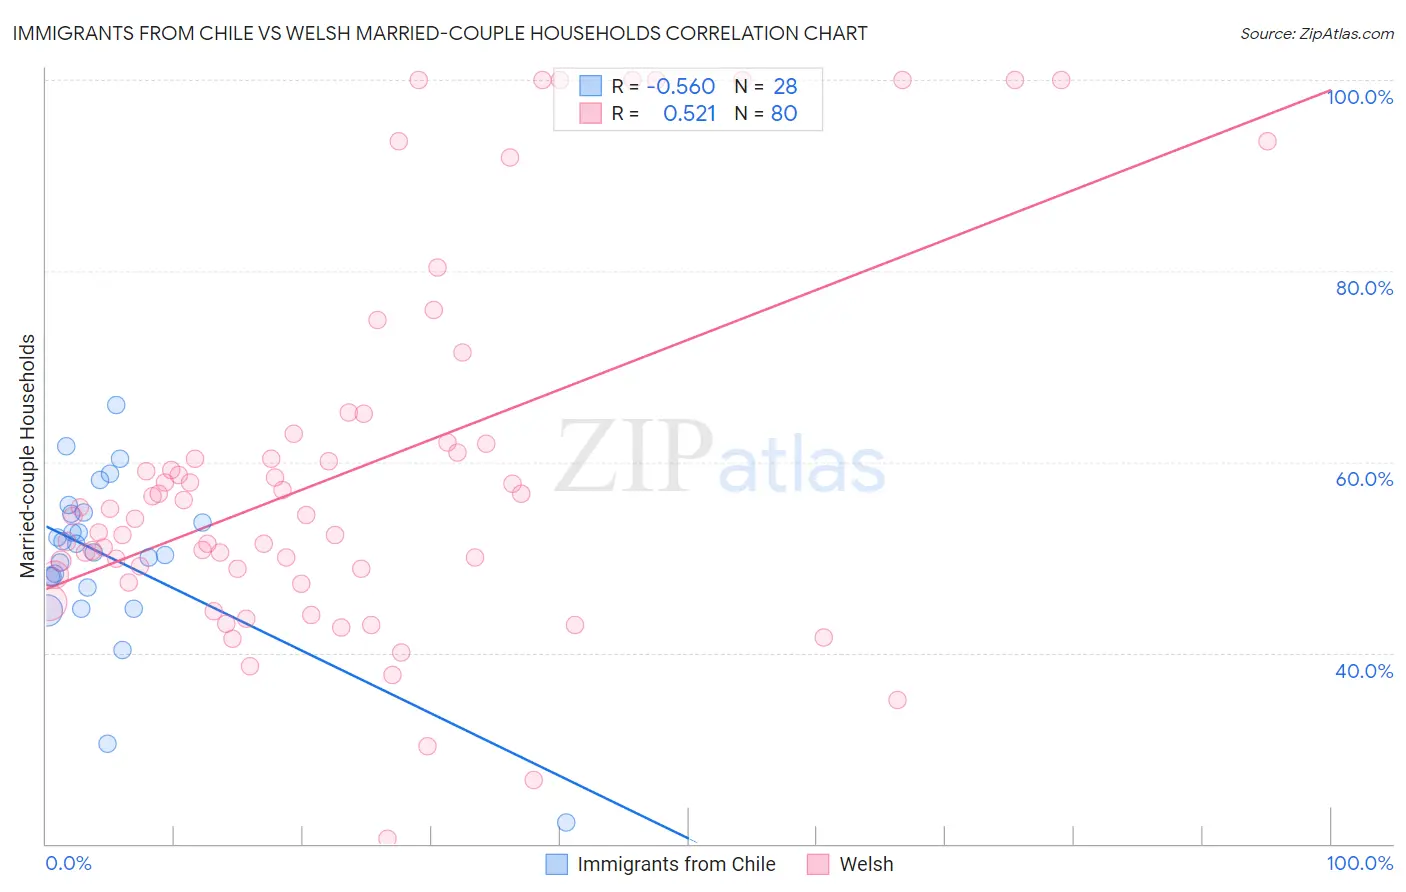
Immigrants from Chile vs Welsh Married-couple Households Correlation Chart
The statistical analysis conducted on geographies consisting of 218,594,724 people shows a substantial negative correlation between the proportion of Immigrants from Chile and percentage of married-couple family households in the United States with a correlation coefficient (R) of -0.560 and weighted average of 46.5%. Similarly, the statistical analysis conducted on geographies consisting of 528,152,714 people shows a substantial positive correlation between the proportion of Welsh and percentage of married-couple family households in the United States with a correlation coefficient (R) of 0.521 and weighted average of 48.8%, a difference of 4.8%.
Married-couple Households Correlation Summary
| Measurement | Immigrants from Chile | Welsh |
| Minimum | 22.2% | 20.5% |
| Maximum | 65.9% | 100.0% |
| Range | 43.7% | 79.5% |
| Mean | 50.0% | 59.0% |
| Median | 51.0% | 54.3% |
| Interquartile 25% (IQ1) | 47.4% | 48.5% |
| Interquartile 75% (IQ3) | 54.6% | 62.0% |
| Interquartile Range (IQR) | 7.2% | 13.5% |
| Standard Deviation (Sample) | 8.8% | 19.3% |
| Standard Deviation (Population) | 8.7% | 19.2% |
Similar Demographics by Married-couple Households
Demographics Similar to Immigrants from Chile by Married-couple Households
In terms of married-couple households, the demographic groups most similar to Immigrants from Chile are Immigrants from Australia (46.5%, a difference of 0.040%), South American (46.6%, a difference of 0.090%), Spanish American Indian (46.6%, a difference of 0.14%), Immigrants from Norway (46.5%, a difference of 0.14%), and Immigrants from Mexico (46.4%, a difference of 0.22%).
| Demographics | Rating | Rank | Married-couple Households |
| Immigrants | Kazakhstan | 70.0 /100 | #164 | Good 46.8% |
| Immigrants | Southern Europe | 69.9 /100 | #165 | Good 46.8% |
| Cherokee | 65.7 /100 | #166 | Good 46.7% |
| Immigrants | Croatia | 64.2 /100 | #167 | Good 46.7% |
| Israelis | 62.3 /100 | #168 | Good 46.7% |
| Spanish American Indians | 59.4 /100 | #169 | Average 46.6% |
| South Americans | 58.0 /100 | #170 | Average 46.6% |
| Immigrants | Chile | 55.7 /100 | #171 | Average 46.5% |
| Immigrants | Australia | 54.6 /100 | #172 | Average 46.5% |
| Immigrants | Norway | 52.0 /100 | #173 | Average 46.5% |
| Immigrants | Mexico | 50.0 /100 | #174 | Average 46.4% |
| Immigrants | Colombia | 46.1 /100 | #175 | Average 46.4% |
| Cajuns | 45.2 /100 | #176 | Average 46.4% |
| Immigrants | Immigrants | 43.8 /100 | #177 | Average 46.3% |
| Immigrants | Costa Rica | 43.4 /100 | #178 | Average 46.3% |
Demographics Similar to Welsh by Married-couple Households
In terms of married-couple households, the demographic groups most similar to Welsh are Immigrants from Eastern Asia (48.8%, a difference of 0.030%), Immigrants from Iran (48.8%, a difference of 0.050%), Tsimshian (48.7%, a difference of 0.080%), Immigrants from Vietnam (48.8%, a difference of 0.10%), and British (48.7%, a difference of 0.10%).
| Demographics | Rating | Rank | Married-couple Households |
| Sri Lankans | 99.7 /100 | #37 | Exceptional 49.0% |
| Greeks | 99.7 /100 | #38 | Exceptional 48.9% |
| Lithuanians | 99.6 /100 | #39 | Exceptional 48.9% |
| Immigrants | Bolivia | 99.6 /100 | #40 | Exceptional 48.9% |
| Immigrants | Lebanon | 99.6 /100 | #41 | Exceptional 48.9% |
| Immigrants | Vietnam | 99.6 /100 | #42 | Exceptional 48.8% |
| Immigrants | Iran | 99.6 /100 | #43 | Exceptional 48.8% |
| Welsh | 99.5 /100 | #44 | Exceptional 48.8% |
| Immigrants | Eastern Asia | 99.5 /100 | #45 | Exceptional 48.8% |
| Tsimshian | 99.5 /100 | #46 | Exceptional 48.7% |
| British | 99.5 /100 | #47 | Exceptional 48.7% |
| Indians (Asian) | 99.4 /100 | #48 | Exceptional 48.7% |
| Immigrants | Sri Lanka | 99.4 /100 | #49 | Exceptional 48.7% |
| Samoans | 99.4 /100 | #50 | Exceptional 48.7% |
| Eastern Europeans | 99.3 /100 | #51 | Exceptional 48.6% |