Immigrants from Caribbean vs White/Caucasian Poverty
COMPARE
Immigrants from Caribbean
White/Caucasian
Poverty
Poverty Comparison
Immigrants from Caribbean
Whites/Caucasians
15.5%
POVERTY
0.0/ 100
METRIC RATING
303rd/ 347
METRIC RANK
12.3%
POVERTY
55.4/ 100
METRIC RATING
169th/ 347
METRIC RANK
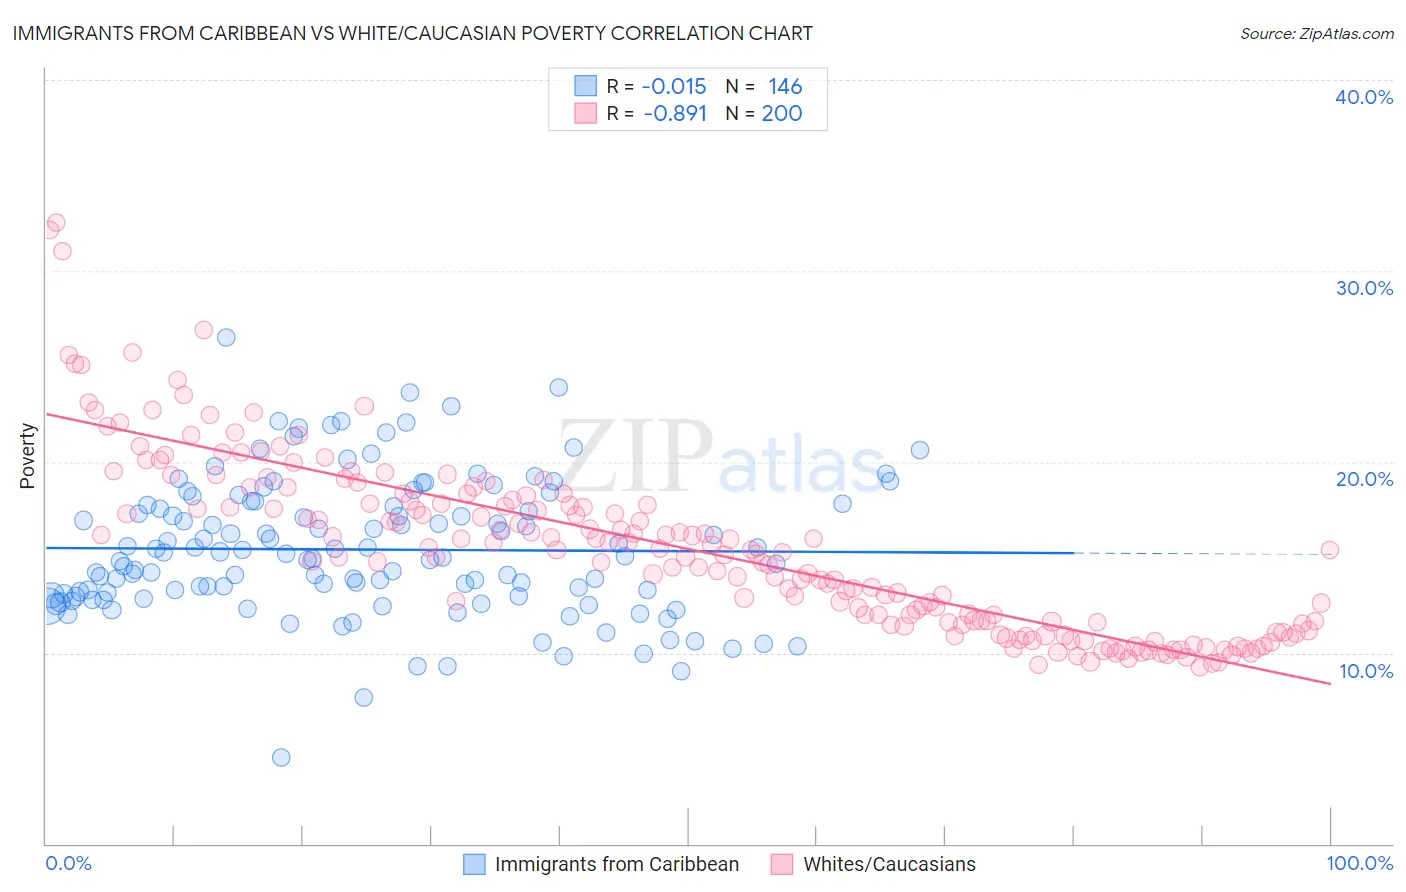
Immigrants from Caribbean vs White/Caucasian Poverty Correlation Chart
The statistical analysis conducted on geographies consisting of 449,609,031 people shows no correlation between the proportion of Immigrants from Caribbean and poverty level in the United States with a correlation coefficient (R) of -0.015 and weighted average of 15.5%. Similarly, the statistical analysis conducted on geographies consisting of 583,792,023 people shows a very strong negative correlation between the proportion of Whites/Caucasians and poverty level in the United States with a correlation coefficient (R) of -0.891 and weighted average of 12.3%, a difference of 26.4%.
Poverty Correlation Summary
| Measurement | Immigrants from Caribbean | White/Caucasian |
| Minimum | 4.5% | 9.2% |
| Maximum | 26.5% | 32.6% |
| Range | 22.0% | 23.3% |
| Mean | 15.4% | 15.4% |
| Median | 15.0% | 15.2% |
| Interquartile 25% (IQ1) | 13.0% | 11.5% |
| Interquartile 75% (IQ3) | 17.7% | 18.0% |
| Interquartile Range (IQR) | 4.8% | 6.5% |
| Standard Deviation (Sample) | 3.6% | 4.6% |
| Standard Deviation (Population) | 3.6% | 4.6% |
Similar Demographics by Poverty
Demographics Similar to Immigrants from Caribbean by Poverty
In terms of poverty, the demographic groups most similar to Immigrants from Caribbean are Immigrants from Mexico (15.5%, a difference of 0.090%), Immigrants from Guatemala (15.5%, a difference of 0.12%), Somali (15.4%, a difference of 0.48%), Creek (15.6%, a difference of 0.56%), and Bahamian (15.4%, a difference of 0.61%).
| Demographics | Rating | Rank | Poverty |
| Hispanics or Latinos | 0.0 /100 | #296 | Tragic 15.3% |
| Immigrants | Bangladesh | 0.0 /100 | #297 | Tragic 15.3% |
| Immigrants | Senegal | 0.0 /100 | #298 | Tragic 15.3% |
| Senegalese | 0.0 /100 | #299 | Tragic 15.3% |
| Immigrants | Central America | 0.0 /100 | #300 | Tragic 15.4% |
| Bahamians | 0.0 /100 | #301 | Tragic 15.4% |
| Somalis | 0.0 /100 | #302 | Tragic 15.4% |
| Immigrants | Caribbean | 0.0 /100 | #303 | Tragic 15.5% |
| Immigrants | Mexico | 0.0 /100 | #304 | Tragic 15.5% |
| Immigrants | Guatemala | 0.0 /100 | #305 | Tragic 15.5% |
| Creek | 0.0 /100 | #306 | Tragic 15.6% |
| Africans | 0.0 /100 | #307 | Tragic 15.6% |
| Choctaw | 0.0 /100 | #308 | Tragic 15.6% |
| Seminole | 0.0 /100 | #309 | Tragic 15.6% |
| Dutch West Indians | 0.0 /100 | #310 | Tragic 15.6% |
Demographics Similar to Whites/Caucasians by Poverty
In terms of poverty, the demographic groups most similar to Whites/Caucasians are Immigrants from Oceania (12.3%, a difference of 0.080%), Immigrants from Venezuela (12.2%, a difference of 0.11%), Immigrants from Chile (12.2%, a difference of 0.13%), Venezuelan (12.2%, a difference of 0.15%), and Immigrants from Albania (12.2%, a difference of 0.23%).
| Demographics | Rating | Rank | Poverty |
| Ethiopians | 59.1 /100 | #162 | Average 12.2% |
| Immigrants | Ethiopia | 58.6 /100 | #163 | Average 12.2% |
| Colombians | 57.8 /100 | #164 | Average 12.2% |
| Immigrants | Albania | 57.7 /100 | #165 | Average 12.2% |
| Venezuelans | 56.9 /100 | #166 | Average 12.2% |
| Immigrants | Chile | 56.7 /100 | #167 | Average 12.2% |
| Immigrants | Venezuela | 56.5 /100 | #168 | Average 12.2% |
| Whites/Caucasians | 55.4 /100 | #169 | Average 12.3% |
| Immigrants | Oceania | 54.6 /100 | #170 | Average 12.3% |
| Immigrants | Spain | 51.3 /100 | #171 | Average 12.3% |
| Immigrants | Portugal | 50.5 /100 | #172 | Average 12.3% |
| Celtics | 50.1 /100 | #173 | Average 12.3% |
| Lebanese | 50.0 /100 | #174 | Average 12.3% |
| South Americans | 48.7 /100 | #175 | Average 12.3% |
| Immigrants | Colombia | 47.7 /100 | #176 | Average 12.3% |