Immigrants from Caribbean vs Swedish Poverty
COMPARE
Immigrants from Caribbean
Swedish
Poverty
Poverty Comparison
Immigrants from Caribbean
Swedes
15.5%
POVERTY
0.0/ 100
METRIC RATING
303rd/ 347
METRIC RANK
10.6%
POVERTY
99.7/ 100
METRIC RATING
23rd/ 347
METRIC RANK
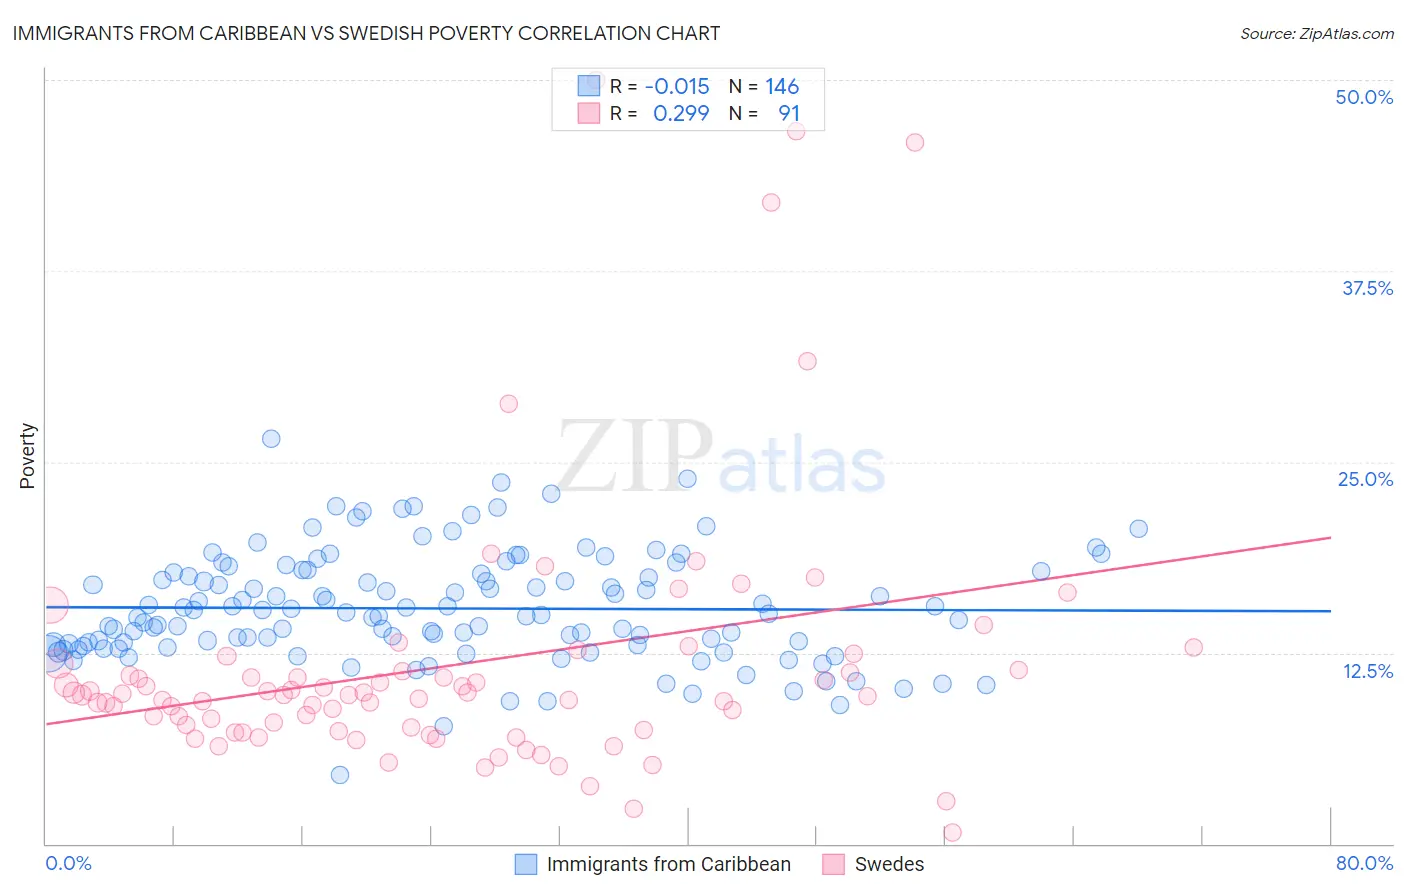
Immigrants from Caribbean vs Swedish Poverty Correlation Chart
The statistical analysis conducted on geographies consisting of 449,609,031 people shows no correlation between the proportion of Immigrants from Caribbean and poverty level in the United States with a correlation coefficient (R) of -0.015 and weighted average of 15.5%. Similarly, the statistical analysis conducted on geographies consisting of 538,612,277 people shows a weak positive correlation between the proportion of Swedes and poverty level in the United States with a correlation coefficient (R) of 0.299 and weighted average of 10.6%, a difference of 46.0%.
Poverty Correlation Summary
| Measurement | Immigrants from Caribbean | Swedish |
| Minimum | 4.5% | 0.75% |
| Maximum | 26.5% | 50.0% |
| Range | 22.0% | 49.2% |
| Mean | 15.4% | 11.7% |
| Median | 15.0% | 9.7% |
| Interquartile 25% (IQ1) | 13.0% | 7.4% |
| Interquartile 75% (IQ3) | 17.7% | 11.4% |
| Interquartile Range (IQR) | 4.8% | 4.0% |
| Standard Deviation (Sample) | 3.6% | 8.7% |
| Standard Deviation (Population) | 3.6% | 8.7% |
Similar Demographics by Poverty
Demographics Similar to Immigrants from Caribbean by Poverty
In terms of poverty, the demographic groups most similar to Immigrants from Caribbean are Immigrants from Mexico (15.5%, a difference of 0.090%), Immigrants from Guatemala (15.5%, a difference of 0.12%), Somali (15.4%, a difference of 0.48%), Creek (15.6%, a difference of 0.56%), and Bahamian (15.4%, a difference of 0.61%).
| Demographics | Rating | Rank | Poverty |
| Hispanics or Latinos | 0.0 /100 | #296 | Tragic 15.3% |
| Immigrants | Bangladesh | 0.0 /100 | #297 | Tragic 15.3% |
| Immigrants | Senegal | 0.0 /100 | #298 | Tragic 15.3% |
| Senegalese | 0.0 /100 | #299 | Tragic 15.3% |
| Immigrants | Central America | 0.0 /100 | #300 | Tragic 15.4% |
| Bahamians | 0.0 /100 | #301 | Tragic 15.4% |
| Somalis | 0.0 /100 | #302 | Tragic 15.4% |
| Immigrants | Caribbean | 0.0 /100 | #303 | Tragic 15.5% |
| Immigrants | Mexico | 0.0 /100 | #304 | Tragic 15.5% |
| Immigrants | Guatemala | 0.0 /100 | #305 | Tragic 15.5% |
| Creek | 0.0 /100 | #306 | Tragic 15.6% |
| Africans | 0.0 /100 | #307 | Tragic 15.6% |
| Choctaw | 0.0 /100 | #308 | Tragic 15.6% |
| Seminole | 0.0 /100 | #309 | Tragic 15.6% |
| Dutch West Indians | 0.0 /100 | #310 | Tragic 15.6% |
Demographics Similar to Swedes by Poverty
In terms of poverty, the demographic groups most similar to Swedes are Italian (10.6%, a difference of 0.050%), Eastern European (10.6%, a difference of 0.11%), Croatian (10.6%, a difference of 0.24%), Luxembourger (10.6%, a difference of 0.27%), and Immigrants from North Macedonia (10.6%, a difference of 0.34%).
| Demographics | Rating | Rank | Poverty |
| Lithuanians | 99.8 /100 | #16 | Exceptional 10.5% |
| Norwegians | 99.8 /100 | #17 | Exceptional 10.5% |
| Latvians | 99.8 /100 | #18 | Exceptional 10.5% |
| Immigrants | Scotland | 99.7 /100 | #19 | Exceptional 10.6% |
| Immigrants | North Macedonia | 99.7 /100 | #20 | Exceptional 10.6% |
| Luxembourgers | 99.7 /100 | #21 | Exceptional 10.6% |
| Eastern Europeans | 99.7 /100 | #22 | Exceptional 10.6% |
| Swedes | 99.7 /100 | #23 | Exceptional 10.6% |
| Italians | 99.7 /100 | #24 | Exceptional 10.6% |
| Croatians | 99.6 /100 | #25 | Exceptional 10.6% |
| Burmese | 99.6 /100 | #26 | Exceptional 10.7% |
| Immigrants | Northern Europe | 99.6 /100 | #27 | Exceptional 10.7% |
| Immigrants | Korea | 99.5 /100 | #28 | Exceptional 10.7% |
| Greeks | 99.5 /100 | #29 | Exceptional 10.7% |
| Danes | 99.5 /100 | #30 | Exceptional 10.7% |