Immigrants from Caribbean vs Armenian Poverty
COMPARE
Immigrants from Caribbean
Armenian
Poverty
Poverty Comparison
Immigrants from Caribbean
Armenians
15.5%
POVERTY
0.0/ 100
METRIC RATING
303rd/ 347
METRIC RANK
12.1%
POVERTY
67.6/ 100
METRIC RATING
152nd/ 347
METRIC RANK
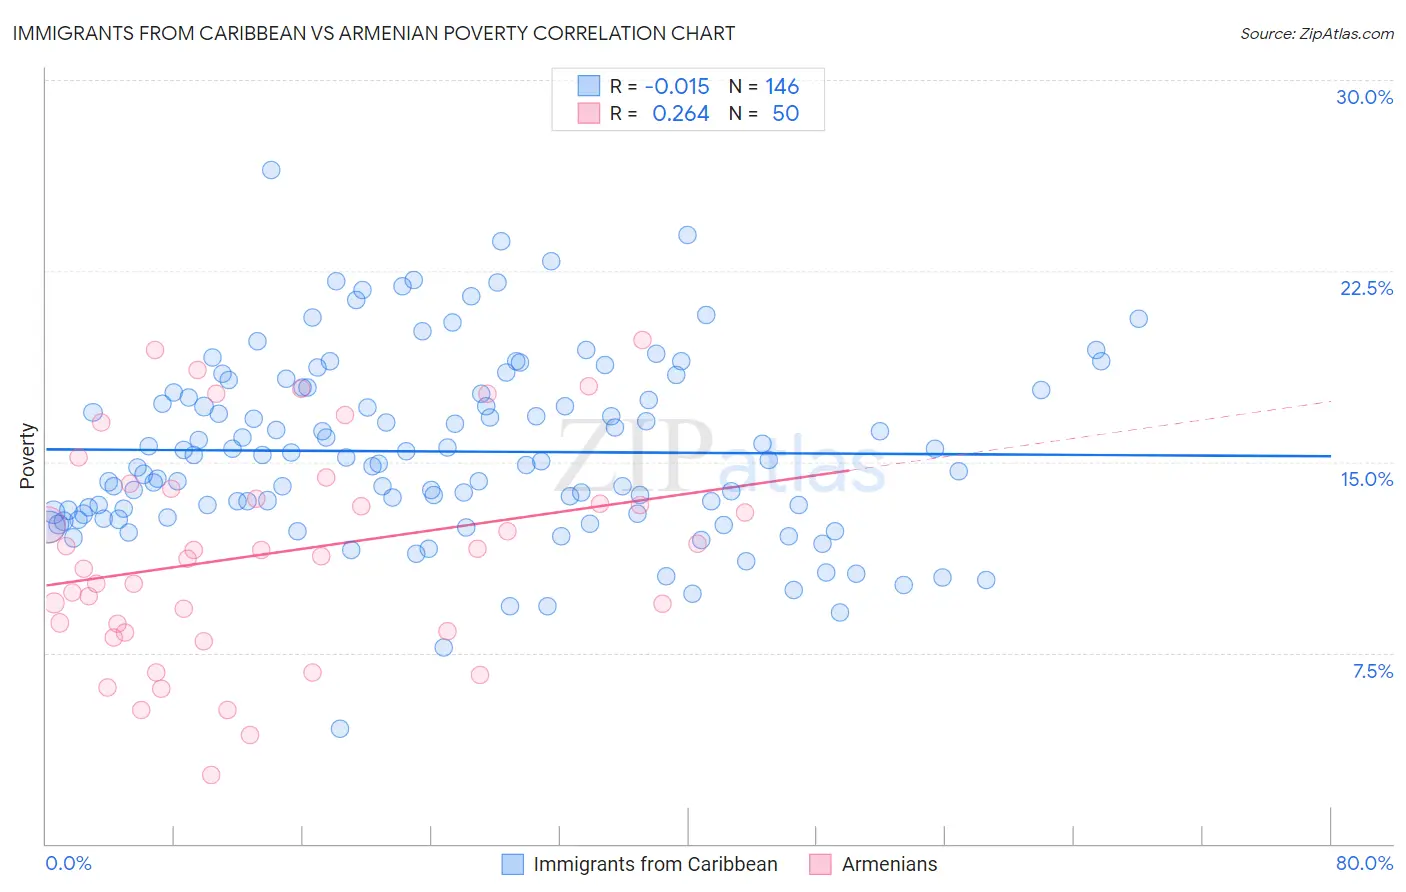
Immigrants from Caribbean vs Armenian Poverty Correlation Chart
The statistical analysis conducted on geographies consisting of 449,609,031 people shows no correlation between the proportion of Immigrants from Caribbean and poverty level in the United States with a correlation coefficient (R) of -0.015 and weighted average of 15.5%. Similarly, the statistical analysis conducted on geographies consisting of 310,820,657 people shows a weak positive correlation between the proportion of Armenians and poverty level in the United States with a correlation coefficient (R) of 0.264 and weighted average of 12.1%, a difference of 28.0%.
Poverty Correlation Summary
| Measurement | Immigrants from Caribbean | Armenian |
| Minimum | 4.5% | 2.7% |
| Maximum | 26.5% | 19.8% |
| Range | 22.0% | 17.1% |
| Mean | 15.4% | 11.4% |
| Median | 15.0% | 11.4% |
| Interquartile 25% (IQ1) | 13.0% | 8.3% |
| Interquartile 75% (IQ3) | 17.7% | 13.9% |
| Interquartile Range (IQR) | 4.8% | 5.6% |
| Standard Deviation (Sample) | 3.6% | 4.2% |
| Standard Deviation (Population) | 3.6% | 4.2% |
Similar Demographics by Poverty
Demographics Similar to Immigrants from Caribbean by Poverty
In terms of poverty, the demographic groups most similar to Immigrants from Caribbean are Immigrants from Mexico (15.5%, a difference of 0.090%), Immigrants from Guatemala (15.5%, a difference of 0.12%), Somali (15.4%, a difference of 0.48%), Creek (15.6%, a difference of 0.56%), and Bahamian (15.4%, a difference of 0.61%).
| Demographics | Rating | Rank | Poverty |
| Hispanics or Latinos | 0.0 /100 | #296 | Tragic 15.3% |
| Immigrants | Bangladesh | 0.0 /100 | #297 | Tragic 15.3% |
| Immigrants | Senegal | 0.0 /100 | #298 | Tragic 15.3% |
| Senegalese | 0.0 /100 | #299 | Tragic 15.3% |
| Immigrants | Central America | 0.0 /100 | #300 | Tragic 15.4% |
| Bahamians | 0.0 /100 | #301 | Tragic 15.4% |
| Somalis | 0.0 /100 | #302 | Tragic 15.4% |
| Immigrants | Caribbean | 0.0 /100 | #303 | Tragic 15.5% |
| Immigrants | Mexico | 0.0 /100 | #304 | Tragic 15.5% |
| Immigrants | Guatemala | 0.0 /100 | #305 | Tragic 15.5% |
| Creek | 0.0 /100 | #306 | Tragic 15.6% |
| Africans | 0.0 /100 | #307 | Tragic 15.6% |
| Choctaw | 0.0 /100 | #308 | Tragic 15.6% |
| Seminole | 0.0 /100 | #309 | Tragic 15.6% |
| Dutch West Indians | 0.0 /100 | #310 | Tragic 15.6% |
Demographics Similar to Armenians by Poverty
In terms of poverty, the demographic groups most similar to Armenians are Immigrants from Northern Africa (12.1%, a difference of 0.41%), Guamanian/Chamorro (12.1%, a difference of 0.41%), Hungarian (12.2%, a difference of 0.44%), Samoan (12.0%, a difference of 0.50%), and Immigrants from Kazakhstan (12.0%, a difference of 0.55%).
| Demographics | Rating | Rank | Poverty |
| Syrians | 75.1 /100 | #145 | Good 12.0% |
| Afghans | 74.9 /100 | #146 | Good 12.0% |
| Immigrants | Bosnia and Herzegovina | 73.7 /100 | #147 | Good 12.0% |
| Immigrants | Germany | 72.7 /100 | #148 | Good 12.0% |
| Immigrants | Malaysia | 72.7 /100 | #149 | Good 12.0% |
| Immigrants | Kazakhstan | 72.3 /100 | #150 | Good 12.0% |
| Samoans | 71.9 /100 | #151 | Good 12.0% |
| Armenians | 67.6 /100 | #152 | Good 12.1% |
| Immigrants | Northern Africa | 63.9 /100 | #153 | Good 12.1% |
| Guamanians/Chamorros | 63.9 /100 | #154 | Good 12.1% |
| Hungarians | 63.6 /100 | #155 | Good 12.2% |
| Scotch-Irish | 62.6 /100 | #156 | Good 12.2% |
| Costa Ricans | 62.2 /100 | #157 | Good 12.2% |
| Taiwanese | 61.8 /100 | #158 | Good 12.2% |
| Pennsylvania Germans | 60.8 /100 | #159 | Good 12.2% |