Immigrants from Canada vs Ghanaian Female Poverty
COMPARE
Immigrants from Canada
Ghanaian
Female Poverty
Female Poverty Comparison
Immigrants from Canada
Ghanaians
12.3%
FEMALE POVERTY
97.5/ 100
METRIC RATING
74th/ 347
METRIC RANK
14.7%
FEMALE POVERTY
1.9/ 100
METRIC RATING
229th/ 347
METRIC RANK
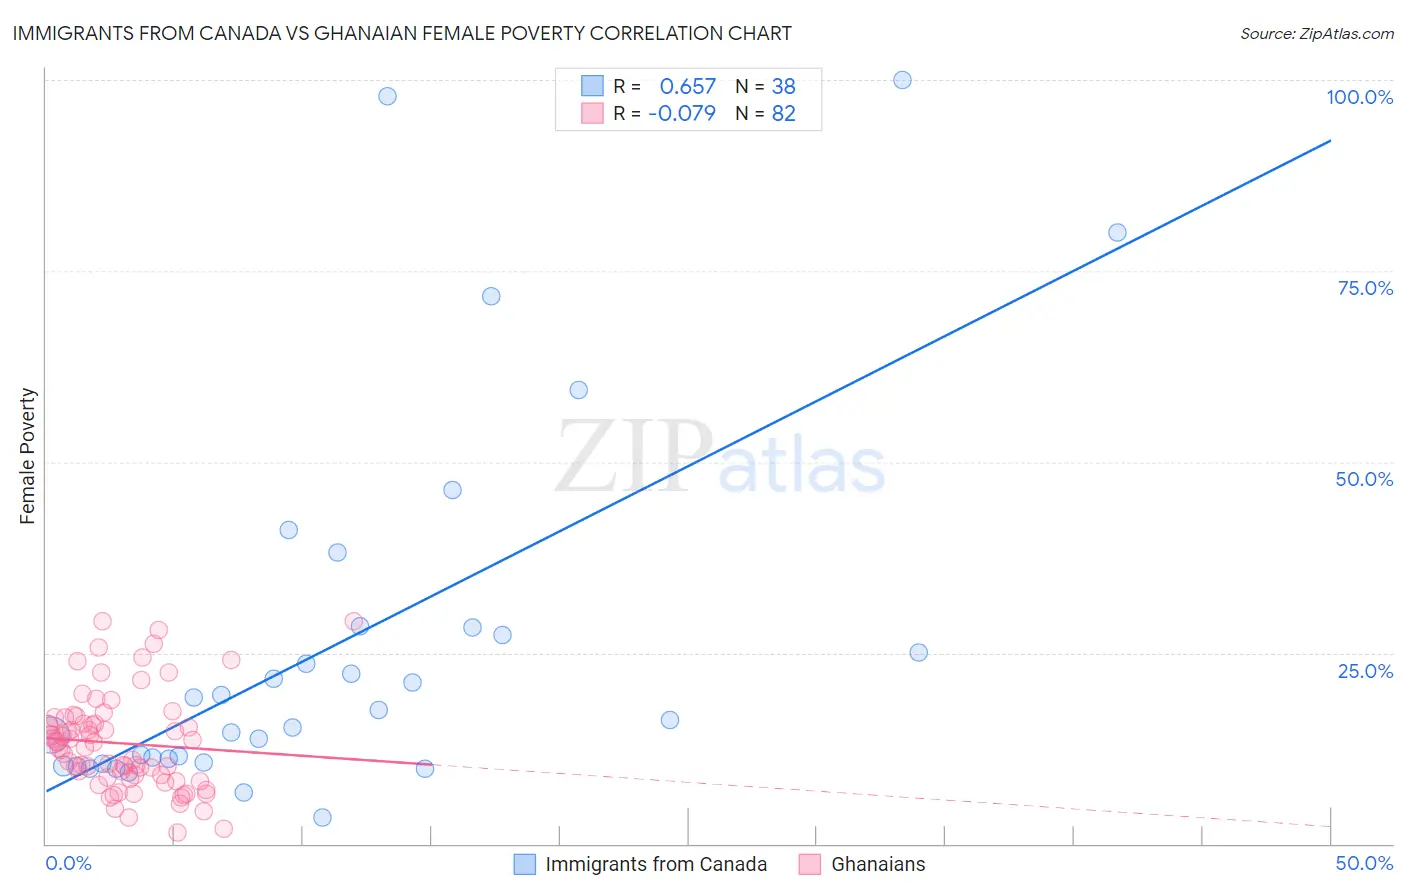
Immigrants from Canada vs Ghanaian Female Poverty Correlation Chart
The statistical analysis conducted on geographies consisting of 458,964,153 people shows a significant positive correlation between the proportion of Immigrants from Canada and poverty level among females in the United States with a correlation coefficient (R) of 0.657 and weighted average of 12.3%. Similarly, the statistical analysis conducted on geographies consisting of 190,346,829 people shows a slight negative correlation between the proportion of Ghanaians and poverty level among females in the United States with a correlation coefficient (R) of -0.079 and weighted average of 14.7%, a difference of 20.1%.
Female Poverty Correlation Summary
| Measurement | Immigrants from Canada | Ghanaian |
| Minimum | 3.5% | 1.5% |
| Maximum | 100.0% | 29.2% |
| Range | 96.5% | 27.7% |
| Mean | 26.2% | 13.2% |
| Median | 16.9% | 12.9% |
| Interquartile 25% (IQ1) | 10.6% | 8.6% |
| Interquartile 75% (IQ3) | 28.3% | 15.7% |
| Interquartile Range (IQR) | 17.8% | 7.1% |
| Standard Deviation (Sample) | 24.5% | 6.3% |
| Standard Deviation (Population) | 24.2% | 6.2% |
Similar Demographics by Female Poverty
Demographics Similar to Immigrants from Canada by Female Poverty
In terms of female poverty, the demographic groups most similar to Immigrants from Canada are Zimbabwean (12.3%, a difference of 0.010%), Cambodian (12.2%, a difference of 0.030%), Carpatho Rusyn (12.2%, a difference of 0.060%), European (12.3%, a difference of 0.12%), and Immigrants from Belgium (12.2%, a difference of 0.19%).
| Demographics | Rating | Rank | Female Poverty |
| Immigrants | Eastern Asia | 97.8 /100 | #67 | Exceptional 12.2% |
| Immigrants | Netherlands | 97.8 /100 | #68 | Exceptional 12.2% |
| Swiss | 97.7 /100 | #69 | Exceptional 12.2% |
| Immigrants | Belgium | 97.7 /100 | #70 | Exceptional 12.2% |
| Carpatho Rusyns | 97.6 /100 | #71 | Exceptional 12.2% |
| Cambodians | 97.5 /100 | #72 | Exceptional 12.2% |
| Zimbabweans | 97.5 /100 | #73 | Exceptional 12.3% |
| Immigrants | Canada | 97.5 /100 | #74 | Exceptional 12.3% |
| Europeans | 97.4 /100 | #75 | Exceptional 12.3% |
| Immigrants | Eastern Europe | 97.2 /100 | #76 | Exceptional 12.3% |
| Serbians | 97.2 /100 | #77 | Exceptional 12.3% |
| Egyptians | 97.2 /100 | #78 | Exceptional 12.3% |
| Immigrants | North America | 97.1 /100 | #79 | Exceptional 12.3% |
| Slovaks | 97.1 /100 | #80 | Exceptional 12.3% |
| Immigrants | Sweden | 97.1 /100 | #81 | Exceptional 12.3% |
Demographics Similar to Ghanaians by Female Poverty
In terms of female poverty, the demographic groups most similar to Ghanaians are German Russian (14.7%, a difference of 0.060%), Alaska Native (14.7%, a difference of 0.20%), Immigrants from Nigeria (14.7%, a difference of 0.21%), Nigerian (14.8%, a difference of 0.30%), and Immigrants from Eritrea (14.6%, a difference of 0.52%).
| Demographics | Rating | Rank | Female Poverty |
| Immigrants | Nonimmigrants | 3.7 /100 | #222 | Tragic 14.5% |
| Immigrants | Africa | 3.3 /100 | #223 | Tragic 14.5% |
| Americans | 2.8 /100 | #224 | Tragic 14.6% |
| Immigrants | Micronesia | 2.8 /100 | #225 | Tragic 14.6% |
| Immigrants | Eritrea | 2.4 /100 | #226 | Tragic 14.6% |
| Immigrants | Nigeria | 2.1 /100 | #227 | Tragic 14.7% |
| German Russians | 2.0 /100 | #228 | Tragic 14.7% |
| Ghanaians | 1.9 /100 | #229 | Tragic 14.7% |
| Alaska Natives | 1.8 /100 | #230 | Tragic 14.7% |
| Nigerians | 1.7 /100 | #231 | Tragic 14.8% |
| Osage | 1.5 /100 | #232 | Tragic 14.8% |
| Immigrants | Saudi Arabia | 1.4 /100 | #233 | Tragic 14.8% |
| Fijians | 1.1 /100 | #234 | Tragic 14.9% |
| Immigrants | Laos | 0.9 /100 | #235 | Tragic 15.0% |
| Cree | 0.7 /100 | #236 | Tragic 15.1% |