Immigrants from Cameroon vs Yup'ik Single Female Poverty
COMPARE
Immigrants from Cameroon
Yup'ik
Single Female Poverty
Single Female Poverty Comparison
Immigrants from Cameroon
Yup'ik
19.8%
SINGLE FEMALE POVERTY
97.3/ 100
METRIC RATING
102nd/ 347
METRIC RANK
26.6%
SINGLE FEMALE POVERTY
0.0/ 100
METRIC RATING
321st/ 347
METRIC RANK
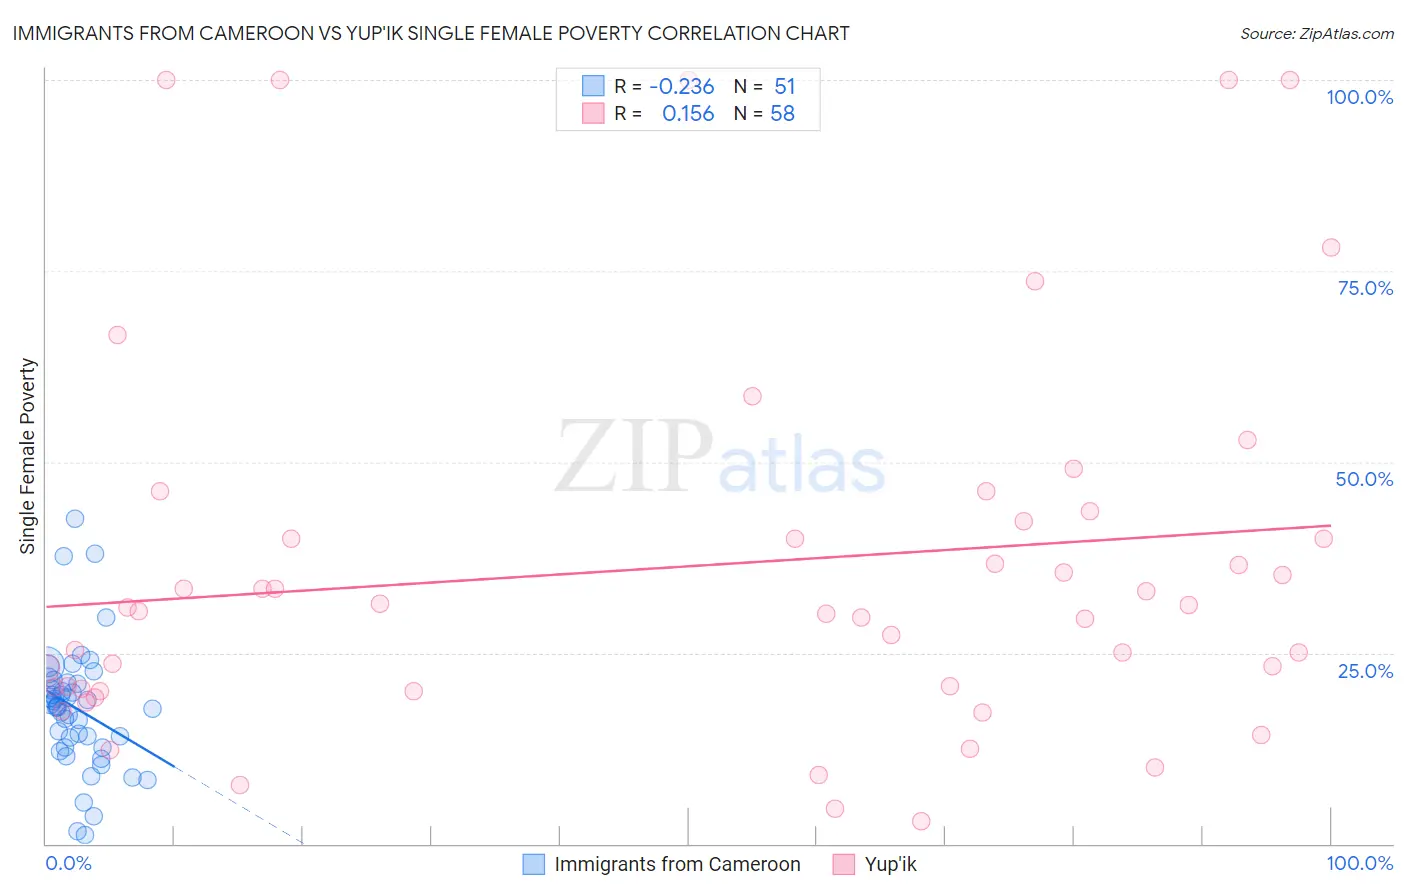
Immigrants from Cameroon vs Yup'ik Single Female Poverty Correlation Chart
The statistical analysis conducted on geographies consisting of 130,300,683 people shows a weak negative correlation between the proportion of Immigrants from Cameroon and poverty level among single females in the United States with a correlation coefficient (R) of -0.236 and weighted average of 19.8%. Similarly, the statistical analysis conducted on geographies consisting of 39,804,505 people shows a poor positive correlation between the proportion of Yup'ik and poverty level among single females in the United States with a correlation coefficient (R) of 0.156 and weighted average of 26.6%, a difference of 34.1%.
Single Female Poverty Correlation Summary
| Measurement | Immigrants from Cameroon | Yup'ik |
| Minimum | 1.1% | 2.9% |
| Maximum | 42.6% | 100.0% |
| Range | 41.5% | 97.1% |
| Mean | 17.7% | 36.3% |
| Median | 18.1% | 30.7% |
| Interquartile 25% (IQ1) | 12.5% | 20.3% |
| Interquartile 75% (IQ3) | 21.1% | 42.3% |
| Interquartile Range (IQR) | 8.5% | 22.0% |
| Standard Deviation (Sample) | 8.1% | 25.0% |
| Standard Deviation (Population) | 8.0% | 24.8% |
Similar Demographics by Single Female Poverty
Demographics Similar to Immigrants from Cameroon by Single Female Poverty
In terms of single female poverty, the demographic groups most similar to Immigrants from Cameroon are Immigrants from Belgium (19.8%, a difference of 0.010%), Immigrants from Southern Europe (19.9%, a difference of 0.12%), Ukrainian (19.8%, a difference of 0.19%), Chilean (19.9%, a difference of 0.24%), and Israeli (19.9%, a difference of 0.25%).
| Demographics | Rating | Rank | Single Female Poverty |
| Estonians | 98.2 /100 | #95 | Exceptional 19.7% |
| Immigrants | Brazil | 98.2 /100 | #96 | Exceptional 19.7% |
| Croatians | 98.1 /100 | #97 | Exceptional 19.7% |
| Immigrants | France | 97.9 /100 | #98 | Exceptional 19.7% |
| Sierra Leoneans | 97.9 /100 | #99 | Exceptional 19.7% |
| Ukrainians | 97.6 /100 | #100 | Exceptional 19.8% |
| Immigrants | Belgium | 97.3 /100 | #101 | Exceptional 19.8% |
| Immigrants | Cameroon | 97.3 /100 | #102 | Exceptional 19.8% |
| Immigrants | Southern Europe | 97.1 /100 | #103 | Exceptional 19.9% |
| Chileans | 96.9 /100 | #104 | Exceptional 19.9% |
| Israelis | 96.9 /100 | #105 | Exceptional 19.9% |
| Ethiopians | 96.7 /100 | #106 | Exceptional 19.9% |
| Immigrants | Syria | 96.7 /100 | #107 | Exceptional 19.9% |
| Native Hawaiians | 96.6 /100 | #108 | Exceptional 19.9% |
| Colombians | 96.6 /100 | #109 | Exceptional 19.9% |
Demographics Similar to Yup'ik by Single Female Poverty
In terms of single female poverty, the demographic groups most similar to Yup'ik are Arapaho (26.4%, a difference of 0.64%), Seminole (26.8%, a difference of 0.74%), Chippewa (26.8%, a difference of 0.84%), Black/African American (26.4%, a difference of 0.95%), and Kiowa (26.9%, a difference of 1.3%).
| Demographics | Rating | Rank | Single Female Poverty |
| Cherokee | 0.0 /100 | #314 | Tragic 25.7% |
| Iroquois | 0.0 /100 | #315 | Tragic 25.7% |
| Immigrants | Somalia | 0.0 /100 | #316 | Tragic 25.8% |
| Ottawa | 0.0 /100 | #317 | Tragic 26.0% |
| Chickasaw | 0.0 /100 | #318 | Tragic 26.3% |
| Blacks/African Americans | 0.0 /100 | #319 | Tragic 26.4% |
| Arapaho | 0.0 /100 | #320 | Tragic 26.4% |
| Yup'ik | 0.0 /100 | #321 | Tragic 26.6% |
| Seminole | 0.0 /100 | #322 | Tragic 26.8% |
| Chippewa | 0.0 /100 | #323 | Tragic 26.8% |
| Kiowa | 0.0 /100 | #324 | Tragic 26.9% |
| Choctaw | 0.0 /100 | #325 | Tragic 27.2% |
| Creek | 0.0 /100 | #326 | Tragic 27.4% |
| Dutch West Indians | 0.0 /100 | #327 | Tragic 27.5% |
| Apache | 0.0 /100 | #328 | Tragic 27.7% |