Immigrants from Belize vs Immigrants from West Indies Female Poverty Among 25-34 Year Olds
COMPARE
Immigrants from Belize
Immigrants from West Indies
Female Poverty Among 25-34 Year Olds
Female Poverty Among 25-34 Year Olds Comparison
Immigrants from Belize
Immigrants from West Indies
15.3%
FEMALE POVERTY AMONG 25-34 YEAR OLDS
0.2/ 100
METRIC RATING
262nd/ 347
METRIC RANK
15.1%
FEMALE POVERTY AMONG 25-34 YEAR OLDS
0.4/ 100
METRIC RATING
253rd/ 347
METRIC RANK
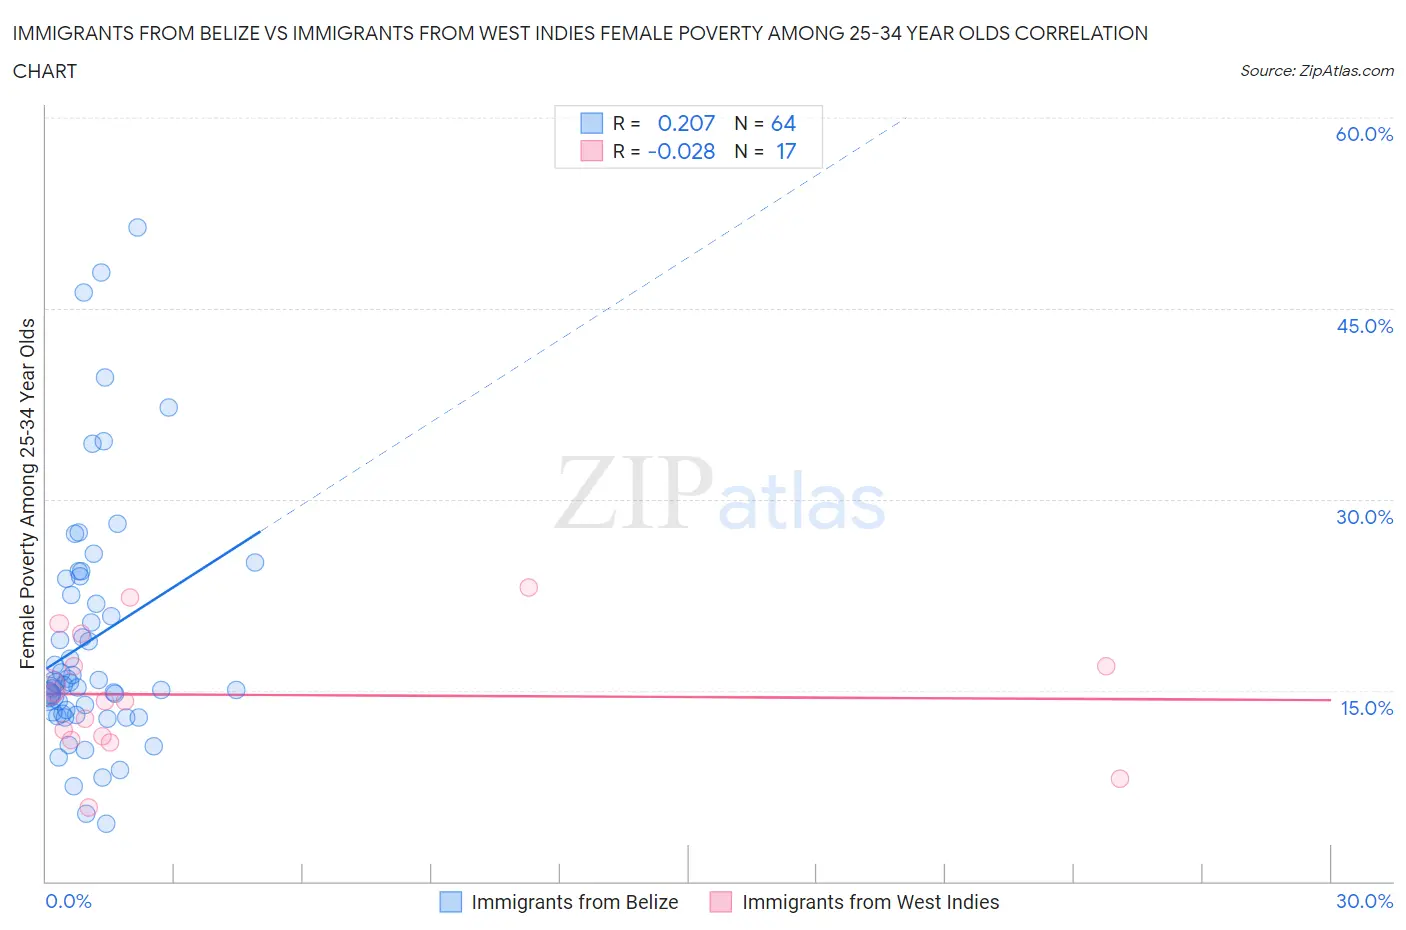
Immigrants from Belize vs Immigrants from West Indies Female Poverty Among 25-34 Year Olds Correlation Chart
The statistical analysis conducted on geographies consisting of 129,916,036 people shows a weak positive correlation between the proportion of Immigrants from Belize and poverty level among females between the ages 25 and 34 in the United States with a correlation coefficient (R) of 0.207 and weighted average of 15.3%. Similarly, the statistical analysis conducted on geographies consisting of 72,346,963 people shows no correlation between the proportion of Immigrants from West Indies and poverty level among females between the ages 25 and 34 in the United States with a correlation coefficient (R) of -0.028 and weighted average of 15.1%, a difference of 1.6%.
Female Poverty Among 25-34 Year Olds Correlation Summary
| Measurement | Immigrants from Belize | Immigrants from West Indies |
| Minimum | 4.5% | 5.8% |
| Maximum | 51.4% | 23.1% |
| Range | 46.9% | 17.3% |
| Mean | 18.9% | 14.6% |
| Median | 15.5% | 14.2% |
| Interquartile 25% (IQ1) | 13.2% | 11.3% |
| Interquartile 75% (IQ3) | 23.1% | 18.2% |
| Interquartile Range (IQR) | 9.9% | 6.9% |
| Standard Deviation (Sample) | 9.7% | 4.8% |
| Standard Deviation (Population) | 9.7% | 4.6% |
Demographics Similar to Immigrants from Belize and Immigrants from West Indies by Female Poverty Among 25-34 Year Olds
In terms of female poverty among 25-34 year olds, the demographic groups most similar to Immigrants from Belize are Liberian (15.3%, a difference of 0.040%), Mexican American Indian (15.4%, a difference of 0.24%), Marshallese (15.3%, a difference of 0.26%), Immigrants from Cuba (15.2%, a difference of 0.63%), and Nepalese (15.2%, a difference of 0.65%). Similarly, the demographic groups most similar to Immigrants from West Indies are Somali (15.1%, a difference of 0.080%), Belizean (15.1%, a difference of 0.14%), Haitian (15.0%, a difference of 0.31%), Immigrants from Laos (15.2%, a difference of 0.47%), and Immigrants from El Salvador (15.0%, a difference of 0.50%).
| Demographics | Rating | Rank | Female Poverty Among 25-34 Year Olds |
| German Russians | 0.8 /100 | #247 | Tragic 14.9% |
| Immigrants | Western Africa | 0.8 /100 | #248 | Tragic 14.9% |
| Immigrants | Haiti | 0.5 /100 | #249 | Tragic 15.0% |
| Immigrants | El Salvador | 0.5 /100 | #250 | Tragic 15.0% |
| Haitians | 0.5 /100 | #251 | Tragic 15.0% |
| Belizeans | 0.4 /100 | #252 | Tragic 15.1% |
| Immigrants | West Indies | 0.4 /100 | #253 | Tragic 15.1% |
| Somalis | 0.4 /100 | #254 | Tragic 15.1% |
| Immigrants | Laos | 0.3 /100 | #255 | Tragic 15.2% |
| West Indians | 0.3 /100 | #256 | Tragic 15.2% |
| Immigrants | Burma/Myanmar | 0.3 /100 | #257 | Tragic 15.2% |
| Nepalese | 0.2 /100 | #258 | Tragic 15.2% |
| Immigrants | Cuba | 0.2 /100 | #259 | Tragic 15.2% |
| Marshallese | 0.2 /100 | #260 | Tragic 15.3% |
| Liberians | 0.2 /100 | #261 | Tragic 15.3% |
| Immigrants | Belize | 0.2 /100 | #262 | Tragic 15.3% |
| Mexican American Indians | 0.2 /100 | #263 | Tragic 15.4% |
| Pennsylvania Germans | 0.1 /100 | #264 | Tragic 15.4% |
| Immigrants | Liberia | 0.1 /100 | #265 | Tragic 15.4% |
| Immigrants | Somalia | 0.1 /100 | #266 | Tragic 15.4% |
| Central Americans | 0.1 /100 | #267 | Tragic 15.5% |