Immigrants from Hungary vs Immigrants from West Indies Female Poverty Among 25-34 Year Olds
COMPARE
Immigrants from Hungary
Immigrants from West Indies
Female Poverty Among 25-34 Year Olds
Female Poverty Among 25-34 Year Olds Comparison
Immigrants from Hungary
Immigrants from West Indies
13.0%
FEMALE POVERTY AMONG 25-34 YEAR OLDS
88.3/ 100
METRIC RATING
132nd/ 347
METRIC RANK
15.1%
FEMALE POVERTY AMONG 25-34 YEAR OLDS
0.4/ 100
METRIC RATING
253rd/ 347
METRIC RANK
Immigrants from Hungary vs Immigrants from West Indies Female Poverty Among 25-34 Year Olds Correlation Chart
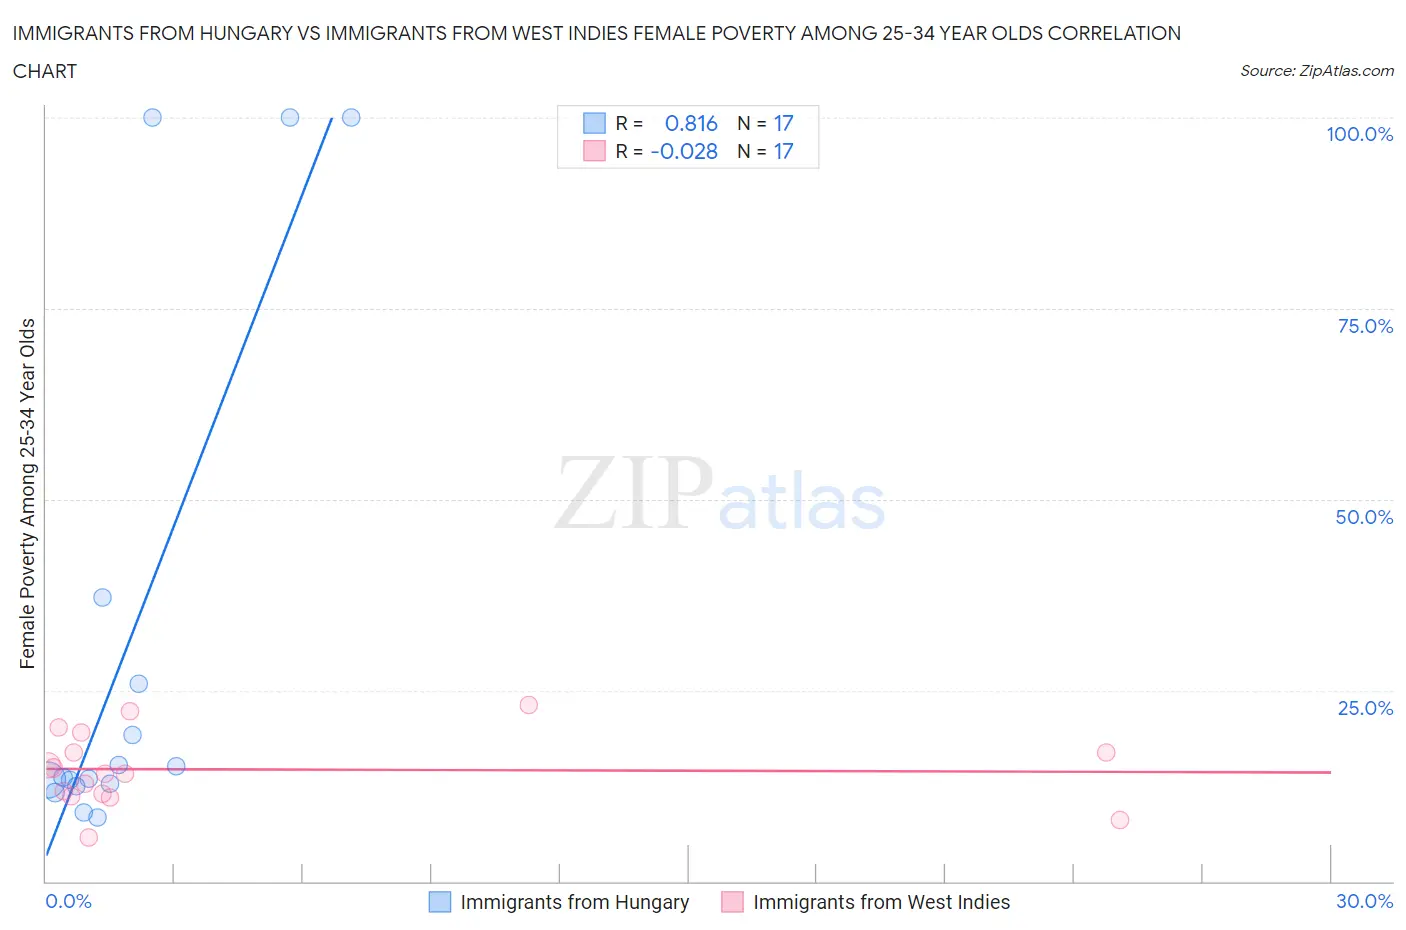
The statistical analysis conducted on geographies consisting of 193,664,103 people shows a very strong positive correlation between the proportion of Immigrants from Hungary and poverty level among females between the ages 25 and 34 in the United States with a correlation coefficient (R) of 0.816 and weighted average of 13.0%. Similarly, the statistical analysis conducted on geographies consisting of 72,346,963 people shows no correlation between the proportion of Immigrants from West Indies and poverty level among females between the ages 25 and 34 in the United States with a correlation coefficient (R) of -0.028 and weighted average of 15.1%, a difference of 16.3%.
Female Poverty Among 25-34 Year Olds Correlation Summary
| Measurement | Immigrants from Hungary | Immigrants from West Indies |
| Minimum | 8.4% | 5.8% |
| Maximum | 100.0% | 23.1% |
| Range | 91.6% | 17.3% |
| Mean | 30.6% | 14.6% |
| Median | 13.6% | 14.2% |
| Interquartile 25% (IQ1) | 12.6% | 11.3% |
| Interquartile 75% (IQ3) | 31.5% | 18.2% |
| Interquartile Range (IQR) | 18.9% | 6.9% |
| Standard Deviation (Sample) | 33.8% | 4.8% |
| Standard Deviation (Population) | 32.8% | 4.6% |
Similar Demographics by Female Poverty Among 25-34 Year Olds
Demographics Similar to Immigrants from Hungary by Female Poverty Among 25-34 Year Olds
In terms of female poverty among 25-34 year olds, the demographic groups most similar to Immigrants from Hungary are Pakistani (13.0%, a difference of 0.020%), Serbian (13.0%, a difference of 0.14%), Immigrants from Uzbekistan (12.9%, a difference of 0.29%), Immigrants from North America (12.9%, a difference of 0.32%), and Syrian (12.9%, a difference of 0.43%).
| Demographics | Rating | Rank | Female Poverty Among 25-34 Year Olds |
| Immigrants | Canada | 91.5 /100 | #125 | Exceptional 12.9% |
| Immigrants | Fiji | 91.2 /100 | #126 | Exceptional 12.9% |
| Czechs | 90.3 /100 | #127 | Exceptional 12.9% |
| Syrians | 90.2 /100 | #128 | Exceptional 12.9% |
| Immigrants | North America | 89.7 /100 | #129 | Excellent 12.9% |
| Immigrants | Uzbekistan | 89.6 /100 | #130 | Excellent 12.9% |
| Pakistanis | 88.4 /100 | #131 | Excellent 13.0% |
| Immigrants | Hungary | 88.3 /100 | #132 | Excellent 13.0% |
| Serbians | 87.6 /100 | #133 | Excellent 13.0% |
| Afghans | 85.8 /100 | #134 | Excellent 13.0% |
| South Africans | 85.7 /100 | #135 | Excellent 13.0% |
| Immigrants | England | 85.5 /100 | #136 | Excellent 13.0% |
| Immigrants | Chile | 84.6 /100 | #137 | Excellent 13.1% |
| Brazilians | 84.5 /100 | #138 | Excellent 13.1% |
| Austrians | 83.7 /100 | #139 | Excellent 13.1% |
Demographics Similar to Immigrants from West Indies by Female Poverty Among 25-34 Year Olds
In terms of female poverty among 25-34 year olds, the demographic groups most similar to Immigrants from West Indies are Somali (15.1%, a difference of 0.080%), Belizean (15.1%, a difference of 0.14%), Haitian (15.0%, a difference of 0.31%), Immigrants from Laos (15.2%, a difference of 0.47%), and Immigrants from El Salvador (15.0%, a difference of 0.50%).
| Demographics | Rating | Rank | Female Poverty Among 25-34 Year Olds |
| Jamaicans | 1.0 /100 | #246 | Tragic 14.8% |
| German Russians | 0.8 /100 | #247 | Tragic 14.9% |
| Immigrants | Western Africa | 0.8 /100 | #248 | Tragic 14.9% |
| Immigrants | Haiti | 0.5 /100 | #249 | Tragic 15.0% |
| Immigrants | El Salvador | 0.5 /100 | #250 | Tragic 15.0% |
| Haitians | 0.5 /100 | #251 | Tragic 15.0% |
| Belizeans | 0.4 /100 | #252 | Tragic 15.1% |
| Immigrants | West Indies | 0.4 /100 | #253 | Tragic 15.1% |
| Somalis | 0.4 /100 | #254 | Tragic 15.1% |
| Immigrants | Laos | 0.3 /100 | #255 | Tragic 15.2% |
| West Indians | 0.3 /100 | #256 | Tragic 15.2% |
| Immigrants | Burma/Myanmar | 0.3 /100 | #257 | Tragic 15.2% |
| Nepalese | 0.2 /100 | #258 | Tragic 15.2% |
| Immigrants | Cuba | 0.2 /100 | #259 | Tragic 15.2% |
| Marshallese | 0.2 /100 | #260 | Tragic 15.3% |