Immigrants from Belize vs Shoshone Female Poverty Among 25-34 Year Olds
COMPARE
Immigrants from Belize
Shoshone
Female Poverty Among 25-34 Year Olds
Female Poverty Among 25-34 Year Olds Comparison
Immigrants from Belize
Shoshone
15.3%
FEMALE POVERTY AMONG 25-34 YEAR OLDS
0.2/ 100
METRIC RATING
262nd/ 347
METRIC RANK
16.2%
FEMALE POVERTY AMONG 25-34 YEAR OLDS
0.0/ 100
METRIC RATING
284th/ 347
METRIC RANK
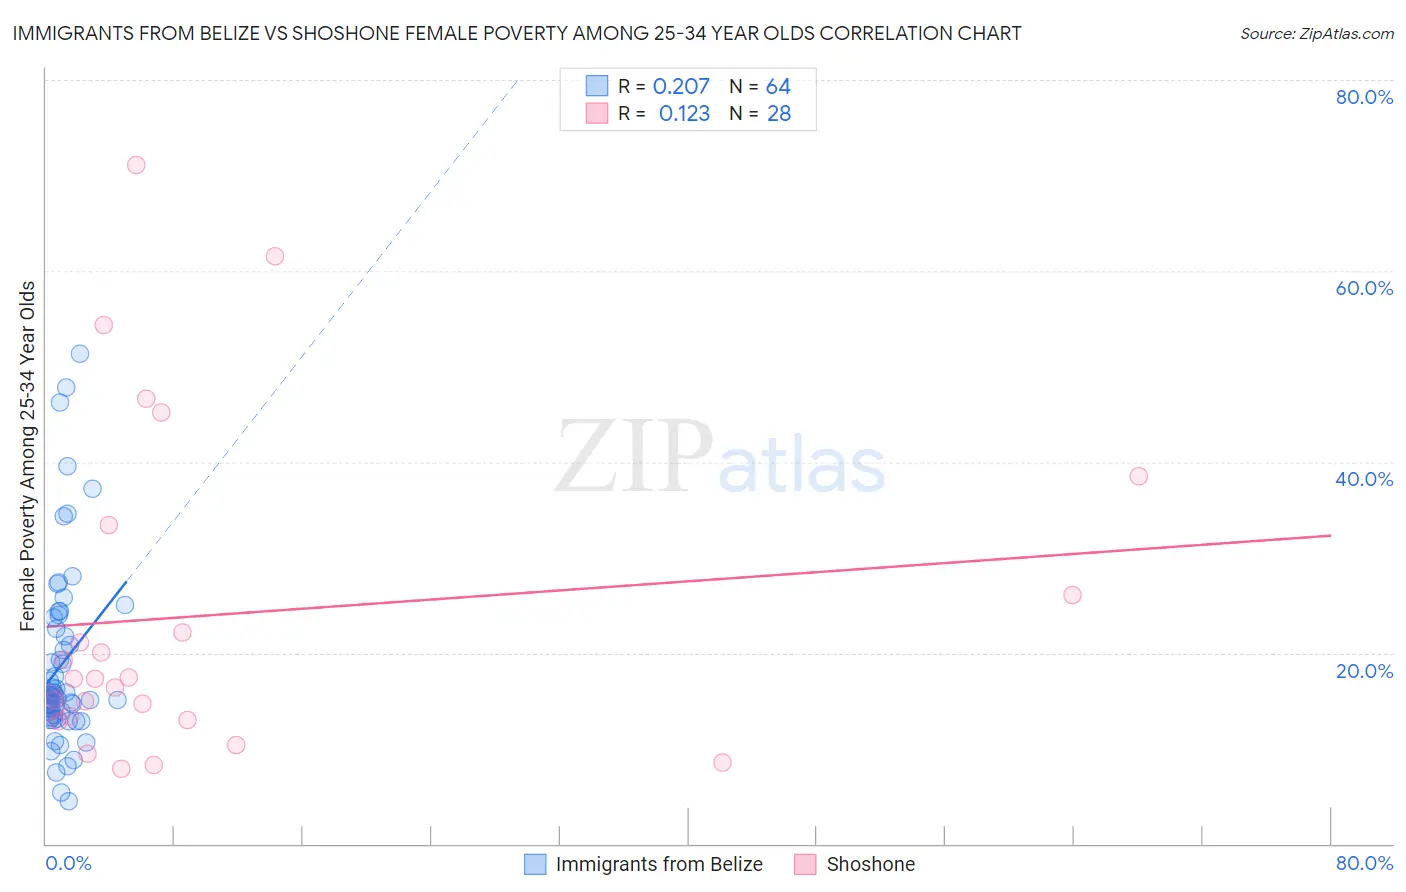
Immigrants from Belize vs Shoshone Female Poverty Among 25-34 Year Olds Correlation Chart
The statistical analysis conducted on geographies consisting of 129,916,036 people shows a weak positive correlation between the proportion of Immigrants from Belize and poverty level among females between the ages 25 and 34 in the United States with a correlation coefficient (R) of 0.207 and weighted average of 15.3%. Similarly, the statistical analysis conducted on geographies consisting of 66,384,090 people shows a poor positive correlation between the proportion of Shoshone and poverty level among females between the ages 25 and 34 in the United States with a correlation coefficient (R) of 0.123 and weighted average of 16.2%, a difference of 6.0%.
Female Poverty Among 25-34 Year Olds Correlation Summary
| Measurement | Immigrants from Belize | Shoshone |
| Minimum | 4.5% | 7.9% |
| Maximum | 51.4% | 71.1% |
| Range | 46.9% | 63.3% |
| Mean | 18.9% | 24.0% |
| Median | 15.5% | 17.3% |
| Interquartile 25% (IQ1) | 13.2% | 13.1% |
| Interquartile 75% (IQ3) | 23.1% | 29.7% |
| Interquartile Range (IQR) | 9.9% | 16.6% |
| Standard Deviation (Sample) | 9.7% | 17.1% |
| Standard Deviation (Population) | 9.7% | 16.8% |
Similar Demographics by Female Poverty Among 25-34 Year Olds
Demographics Similar to Immigrants from Belize by Female Poverty Among 25-34 Year Olds
In terms of female poverty among 25-34 year olds, the demographic groups most similar to Immigrants from Belize are Liberian (15.3%, a difference of 0.040%), Mexican American Indian (15.4%, a difference of 0.24%), Marshallese (15.3%, a difference of 0.26%), Immigrants from Cuba (15.2%, a difference of 0.63%), and Nepalese (15.2%, a difference of 0.65%).
| Demographics | Rating | Rank | Female Poverty Among 25-34 Year Olds |
| Immigrants | Laos | 0.3 /100 | #255 | Tragic 15.2% |
| West Indians | 0.3 /100 | #256 | Tragic 15.2% |
| Immigrants | Burma/Myanmar | 0.3 /100 | #257 | Tragic 15.2% |
| Nepalese | 0.2 /100 | #258 | Tragic 15.2% |
| Immigrants | Cuba | 0.2 /100 | #259 | Tragic 15.2% |
| Marshallese | 0.2 /100 | #260 | Tragic 15.3% |
| Liberians | 0.2 /100 | #261 | Tragic 15.3% |
| Immigrants | Belize | 0.2 /100 | #262 | Tragic 15.3% |
| Mexican American Indians | 0.2 /100 | #263 | Tragic 15.4% |
| Pennsylvania Germans | 0.1 /100 | #264 | Tragic 15.4% |
| Immigrants | Liberia | 0.1 /100 | #265 | Tragic 15.4% |
| Immigrants | Somalia | 0.1 /100 | #266 | Tragic 15.4% |
| Central Americans | 0.1 /100 | #267 | Tragic 15.5% |
| Immigrants | Senegal | 0.1 /100 | #268 | Tragic 15.6% |
| Sub-Saharan Africans | 0.1 /100 | #269 | Tragic 15.6% |
Demographics Similar to Shoshone by Female Poverty Among 25-34 Year Olds
In terms of female poverty among 25-34 year olds, the demographic groups most similar to Shoshone are Immigrants from Bahamas (16.3%, a difference of 0.50%), Cape Verdean (16.3%, a difference of 0.68%), American (16.4%, a difference of 0.73%), Bahamian (16.1%, a difference of 0.83%), and Aleut (16.1%, a difference of 0.87%).
| Demographics | Rating | Rank | Female Poverty Among 25-34 Year Olds |
| Immigrants | Micronesia | 0.0 /100 | #277 | Tragic 15.8% |
| French American Indians | 0.0 /100 | #278 | Tragic 15.9% |
| Fijians | 0.0 /100 | #279 | Tragic 15.9% |
| Bangladeshis | 0.0 /100 | #280 | Tragic 15.9% |
| Immigrants | Latin America | 0.0 /100 | #281 | Tragic 16.0% |
| Aleuts | 0.0 /100 | #282 | Tragic 16.1% |
| Bahamians | 0.0 /100 | #283 | Tragic 16.1% |
| Shoshone | 0.0 /100 | #284 | Tragic 16.2% |
| Immigrants | Bahamas | 0.0 /100 | #285 | Tragic 16.3% |
| Cape Verdeans | 0.0 /100 | #286 | Tragic 16.3% |
| Americans | 0.0 /100 | #287 | Tragic 16.4% |
| Guatemalans | 0.0 /100 | #288 | Tragic 16.4% |
| Osage | 0.0 /100 | #289 | Tragic 16.4% |
| Indonesians | 0.0 /100 | #290 | Tragic 16.4% |
| Comanche | 0.0 /100 | #291 | Tragic 16.5% |