Immigrants from Belgium vs Dutch Female Poverty Among 18-24 Year Olds
COMPARE
Immigrants from Belgium
Dutch
Female Poverty Among 18-24 Year Olds
Female Poverty Among 18-24 Year Olds Comparison
Immigrants from Belgium
Dutch
19.8%
FEMALE POVERTY AMONG 18-24 YEAR OLDS
76.4/ 100
METRIC RATING
156th/ 347
METRIC RANK
20.5%
FEMALE POVERTY AMONG 18-24 YEAR OLDS
15.9/ 100
METRIC RATING
208th/ 347
METRIC RANK
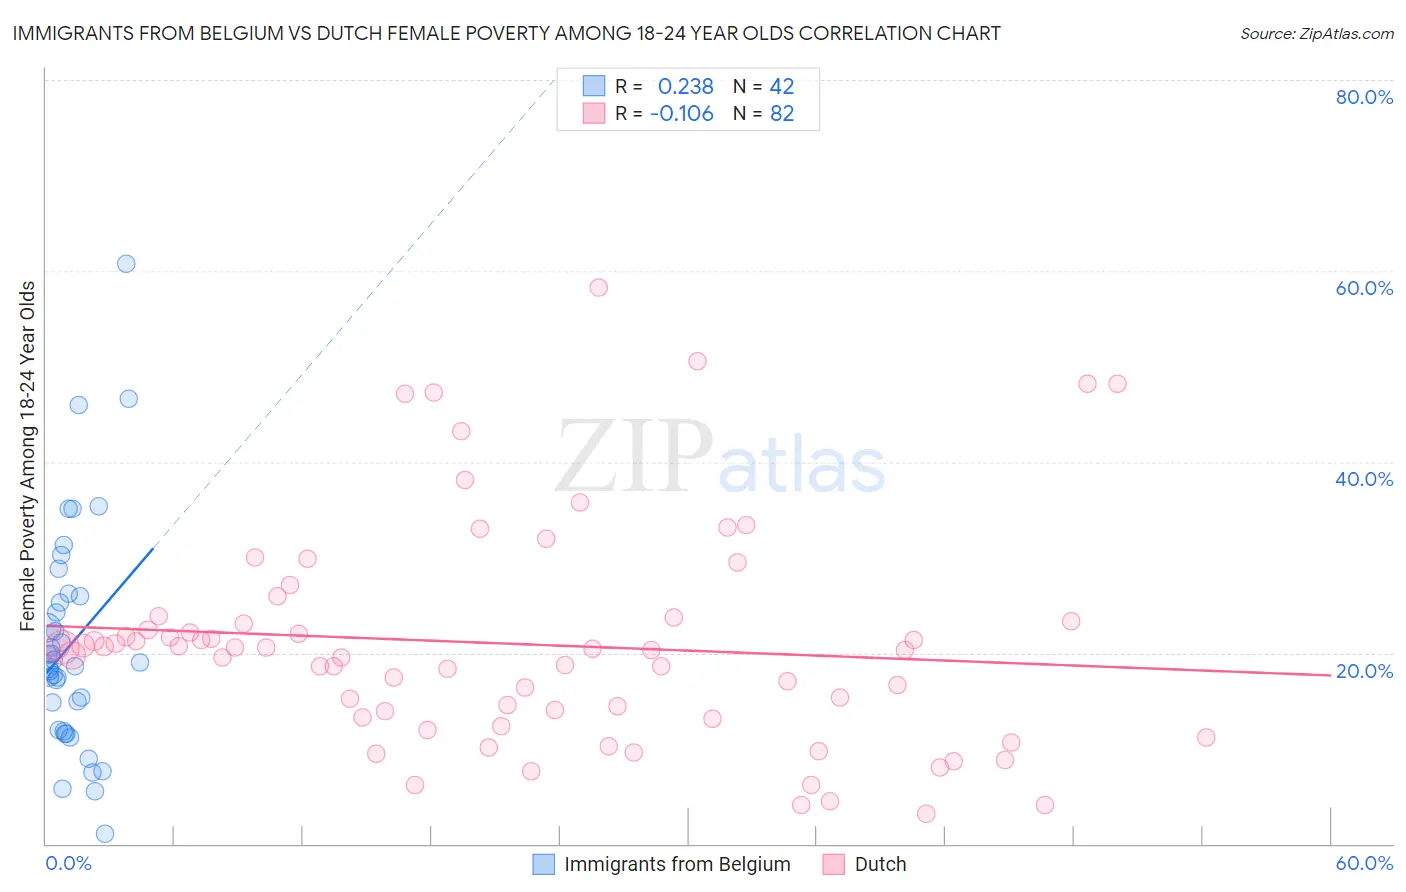
Immigrants from Belgium vs Dutch Female Poverty Among 18-24 Year Olds Correlation Chart
The statistical analysis conducted on geographies consisting of 144,999,845 people shows a weak positive correlation between the proportion of Immigrants from Belgium and poverty level among females between the ages 18 and 24 in the United States with a correlation coefficient (R) of 0.238 and weighted average of 19.8%. Similarly, the statistical analysis conducted on geographies consisting of 523,124,307 people shows a poor negative correlation between the proportion of Dutch and poverty level among females between the ages 18 and 24 in the United States with a correlation coefficient (R) of -0.106 and weighted average of 20.5%, a difference of 3.5%.
Female Poverty Among 18-24 Year Olds Correlation Summary
| Measurement | Immigrants from Belgium | Dutch |
| Minimum | 0.99% | 3.2% |
| Maximum | 60.8% | 58.3% |
| Range | 59.8% | 55.1% |
| Mean | 20.9% | 20.9% |
| Median | 18.8% | 20.4% |
| Interquartile 25% (IQ1) | 11.9% | 13.2% |
| Interquartile 75% (IQ3) | 26.0% | 23.3% |
| Interquartile Range (IQR) | 14.1% | 10.1% |
| Standard Deviation (Sample) | 11.9% | 11.5% |
| Standard Deviation (Population) | 11.8% | 11.4% |
Similar Demographics by Female Poverty Among 18-24 Year Olds
Demographics Similar to Immigrants from Belgium by Female Poverty Among 18-24 Year Olds
In terms of female poverty among 18-24 year olds, the demographic groups most similar to Immigrants from Belgium are Hungarian (19.8%, a difference of 0.010%), Immigrants from Zimbabwe (19.8%, a difference of 0.020%), Danish (19.8%, a difference of 0.060%), Immigrants from Lebanon (19.8%, a difference of 0.080%), and Immigrants from Japan (19.8%, a difference of 0.12%).
| Demographics | Rating | Rank | Female Poverty Among 18-24 Year Olds |
| Immigrants | Oceania | 81.2 /100 | #149 | Excellent 19.7% |
| Syrians | 80.2 /100 | #150 | Excellent 19.8% |
| Immigrants | Eastern Asia | 79.7 /100 | #151 | Good 19.8% |
| Yugoslavians | 79.0 /100 | #152 | Good 19.8% |
| Immigrants | Japan | 78.1 /100 | #153 | Good 19.8% |
| Immigrants | Zimbabwe | 76.7 /100 | #154 | Good 19.8% |
| Hungarians | 76.6 /100 | #155 | Good 19.8% |
| Immigrants | Belgium | 76.4 /100 | #156 | Good 19.8% |
| Danes | 75.5 /100 | #157 | Good 19.8% |
| Immigrants | Lebanon | 75.3 /100 | #158 | Good 19.8% |
| Trinidadians and Tobagonians | 74.4 /100 | #159 | Good 19.8% |
| Pakistanis | 74.1 /100 | #160 | Good 19.8% |
| Immigrants | Belize | 74.1 /100 | #161 | Good 19.8% |
| French Canadians | 73.0 /100 | #162 | Good 19.9% |
| Malaysians | 72.7 /100 | #163 | Good 19.9% |
Demographics Similar to Dutch by Female Poverty Among 18-24 Year Olds
In terms of female poverty among 18-24 year olds, the demographic groups most similar to Dutch are Arab (20.5%, a difference of 0.030%), Spaniard (20.5%, a difference of 0.040%), English (20.5%, a difference of 0.070%), Hispanic or Latino (20.5%, a difference of 0.070%), and Immigrants from Netherlands (20.5%, a difference of 0.10%).
| Demographics | Rating | Rank | Female Poverty Among 18-24 Year Olds |
| Mexicans | 18.3 /100 | #201 | Poor 20.5% |
| Immigrants | Turkey | 17.7 /100 | #202 | Poor 20.5% |
| Immigrants | Malaysia | 17.2 /100 | #203 | Poor 20.5% |
| Immigrants | Netherlands | 17.0 /100 | #204 | Poor 20.5% |
| English | 16.7 /100 | #205 | Poor 20.5% |
| Hispanics or Latinos | 16.6 /100 | #206 | Poor 20.5% |
| Spaniards | 16.3 /100 | #207 | Poor 20.5% |
| Dutch | 15.9 /100 | #208 | Poor 20.5% |
| Arabs | 15.5 /100 | #209 | Poor 20.5% |
| Immigrants | Ghana | 14.3 /100 | #210 | Poor 20.5% |
| Immigrants | Western Europe | 13.5 /100 | #211 | Poor 20.6% |
| Liberians | 11.6 /100 | #212 | Poor 20.6% |
| Northern Europeans | 11.6 /100 | #213 | Poor 20.6% |
| Immigrants | South Africa | 10.7 /100 | #214 | Poor 20.6% |
| Spanish | 10.4 /100 | #215 | Poor 20.6% |