Immigrants from Belgium vs Bermudan Female Poverty Among 18-24 Year Olds
COMPARE
Immigrants from Belgium
Bermudan
Female Poverty Among 18-24 Year Olds
Female Poverty Among 18-24 Year Olds Comparison
Immigrants from Belgium
Bermudans
19.8%
FEMALE POVERTY AMONG 18-24 YEAR OLDS
76.4/ 100
METRIC RATING
156th/ 347
METRIC RANK
21.9%
FEMALE POVERTY AMONG 18-24 YEAR OLDS
0.1/ 100
METRIC RATING
282nd/ 347
METRIC RANK
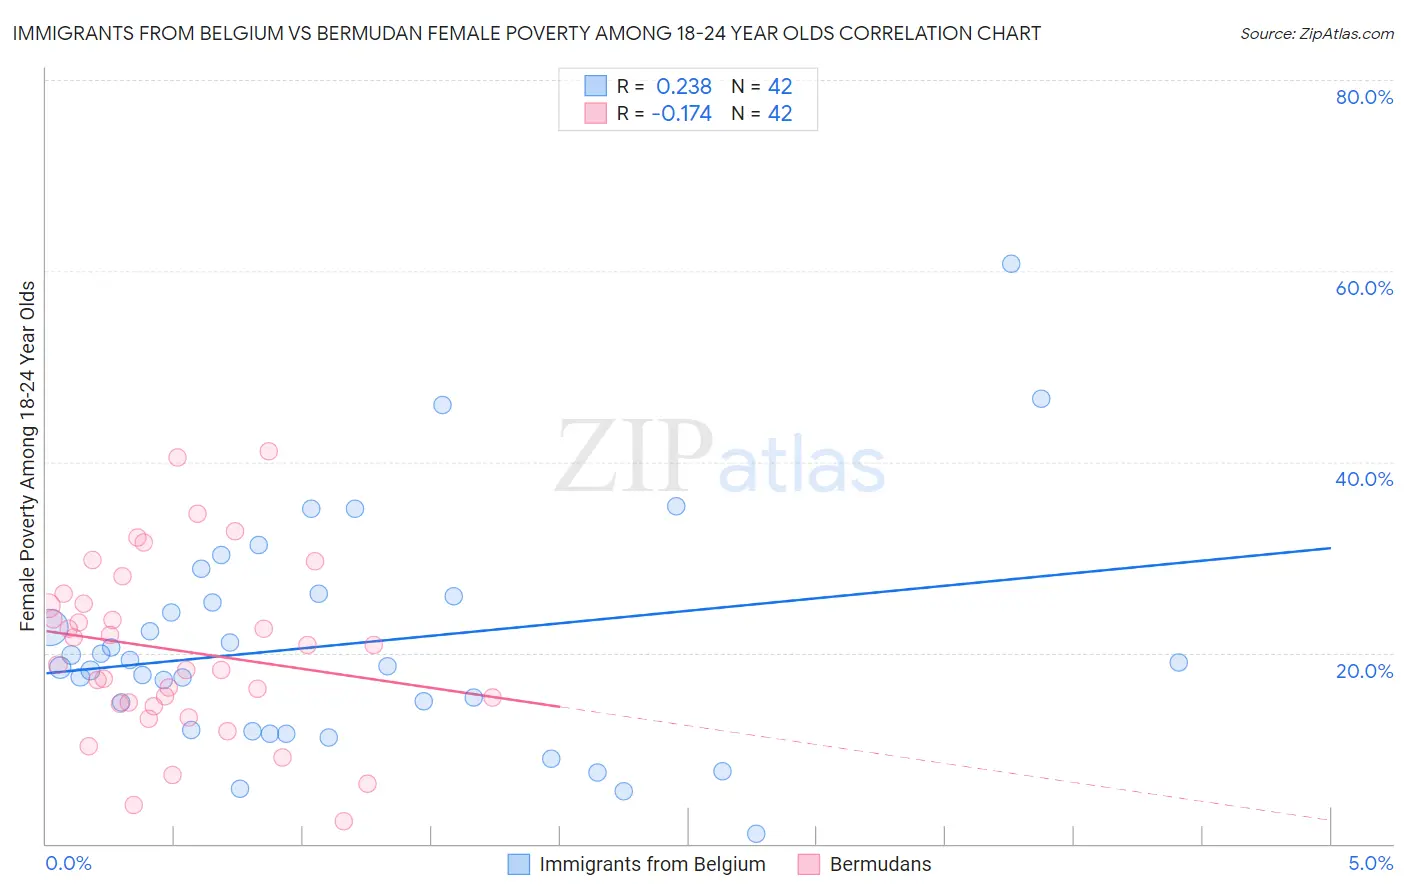
Immigrants from Belgium vs Bermudan Female Poverty Among 18-24 Year Olds Correlation Chart
The statistical analysis conducted on geographies consisting of 144,999,845 people shows a weak positive correlation between the proportion of Immigrants from Belgium and poverty level among females between the ages 18 and 24 in the United States with a correlation coefficient (R) of 0.238 and weighted average of 19.8%. Similarly, the statistical analysis conducted on geographies consisting of 55,519,020 people shows a poor negative correlation between the proportion of Bermudans and poverty level among females between the ages 18 and 24 in the United States with a correlation coefficient (R) of -0.174 and weighted average of 21.9%, a difference of 10.8%.
Female Poverty Among 18-24 Year Olds Correlation Summary
| Measurement | Immigrants from Belgium | Bermudan |
| Minimum | 0.99% | 2.4% |
| Maximum | 60.8% | 41.1% |
| Range | 59.8% | 38.7% |
| Mean | 20.9% | 20.3% |
| Median | 18.8% | 19.8% |
| Interquartile 25% (IQ1) | 11.9% | 14.7% |
| Interquartile 75% (IQ3) | 26.0% | 25.1% |
| Interquartile Range (IQR) | 14.1% | 10.4% |
| Standard Deviation (Sample) | 11.9% | 9.1% |
| Standard Deviation (Population) | 11.8% | 9.0% |
Similar Demographics by Female Poverty Among 18-24 Year Olds
Demographics Similar to Immigrants from Belgium by Female Poverty Among 18-24 Year Olds
In terms of female poverty among 18-24 year olds, the demographic groups most similar to Immigrants from Belgium are Hungarian (19.8%, a difference of 0.010%), Immigrants from Zimbabwe (19.8%, a difference of 0.020%), Danish (19.8%, a difference of 0.060%), Immigrants from Lebanon (19.8%, a difference of 0.080%), and Immigrants from Japan (19.8%, a difference of 0.12%).
| Demographics | Rating | Rank | Female Poverty Among 18-24 Year Olds |
| Immigrants | Oceania | 81.2 /100 | #149 | Excellent 19.7% |
| Syrians | 80.2 /100 | #150 | Excellent 19.8% |
| Immigrants | Eastern Asia | 79.7 /100 | #151 | Good 19.8% |
| Yugoslavians | 79.0 /100 | #152 | Good 19.8% |
| Immigrants | Japan | 78.1 /100 | #153 | Good 19.8% |
| Immigrants | Zimbabwe | 76.7 /100 | #154 | Good 19.8% |
| Hungarians | 76.6 /100 | #155 | Good 19.8% |
| Immigrants | Belgium | 76.4 /100 | #156 | Good 19.8% |
| Danes | 75.5 /100 | #157 | Good 19.8% |
| Immigrants | Lebanon | 75.3 /100 | #158 | Good 19.8% |
| Trinidadians and Tobagonians | 74.4 /100 | #159 | Good 19.8% |
| Pakistanis | 74.1 /100 | #160 | Good 19.8% |
| Immigrants | Belize | 74.1 /100 | #161 | Good 19.8% |
| French Canadians | 73.0 /100 | #162 | Good 19.9% |
| Malaysians | 72.7 /100 | #163 | Good 19.9% |
Demographics Similar to Bermudans by Female Poverty Among 18-24 Year Olds
In terms of female poverty among 18-24 year olds, the demographic groups most similar to Bermudans are Immigrants from Dominican Republic (21.9%, a difference of 0.090%), Immigrants from Dominica (21.9%, a difference of 0.13%), Spanish American (21.9%, a difference of 0.14%), Subsaharan African (22.0%, a difference of 0.30%), and Yaqui (21.9%, a difference of 0.31%).
| Demographics | Rating | Rank | Female Poverty Among 18-24 Year Olds |
| Immigrants | Bangladesh | 0.1 /100 | #275 | Tragic 21.8% |
| Bahamians | 0.1 /100 | #276 | Tragic 21.8% |
| Immigrants | Switzerland | 0.1 /100 | #277 | Tragic 21.8% |
| Yaqui | 0.1 /100 | #278 | Tragic 21.9% |
| Spanish Americans | 0.1 /100 | #279 | Tragic 21.9% |
| Immigrants | Dominica | 0.1 /100 | #280 | Tragic 21.9% |
| Immigrants | Dominican Republic | 0.1 /100 | #281 | Tragic 21.9% |
| Bermudans | 0.1 /100 | #282 | Tragic 21.9% |
| Sub-Saharan Africans | 0.0 /100 | #283 | Tragic 22.0% |
| Tlingit-Haida | 0.0 /100 | #284 | Tragic 22.0% |
| Ottawa | 0.0 /100 | #285 | Tragic 22.0% |
| Ugandans | 0.0 /100 | #286 | Tragic 22.1% |
| Immigrants | Middle Africa | 0.0 /100 | #287 | Tragic 22.1% |
| Dominicans | 0.0 /100 | #288 | Tragic 22.3% |
| French American Indians | 0.0 /100 | #289 | Tragic 22.3% |