Immigrants from Bangladesh vs Immigrants Female Poverty
COMPARE
Immigrants from Bangladesh
Immigrants
Female Poverty
Female Poverty Comparison
Immigrants from Bangladesh
Immigrants
16.4%
FEMALE POVERTY
0.0/ 100
METRIC RATING
290th/ 347
METRIC RANK
14.4%
FEMALE POVERTY
4.5/ 100
METRIC RATING
217th/ 347
METRIC RANK
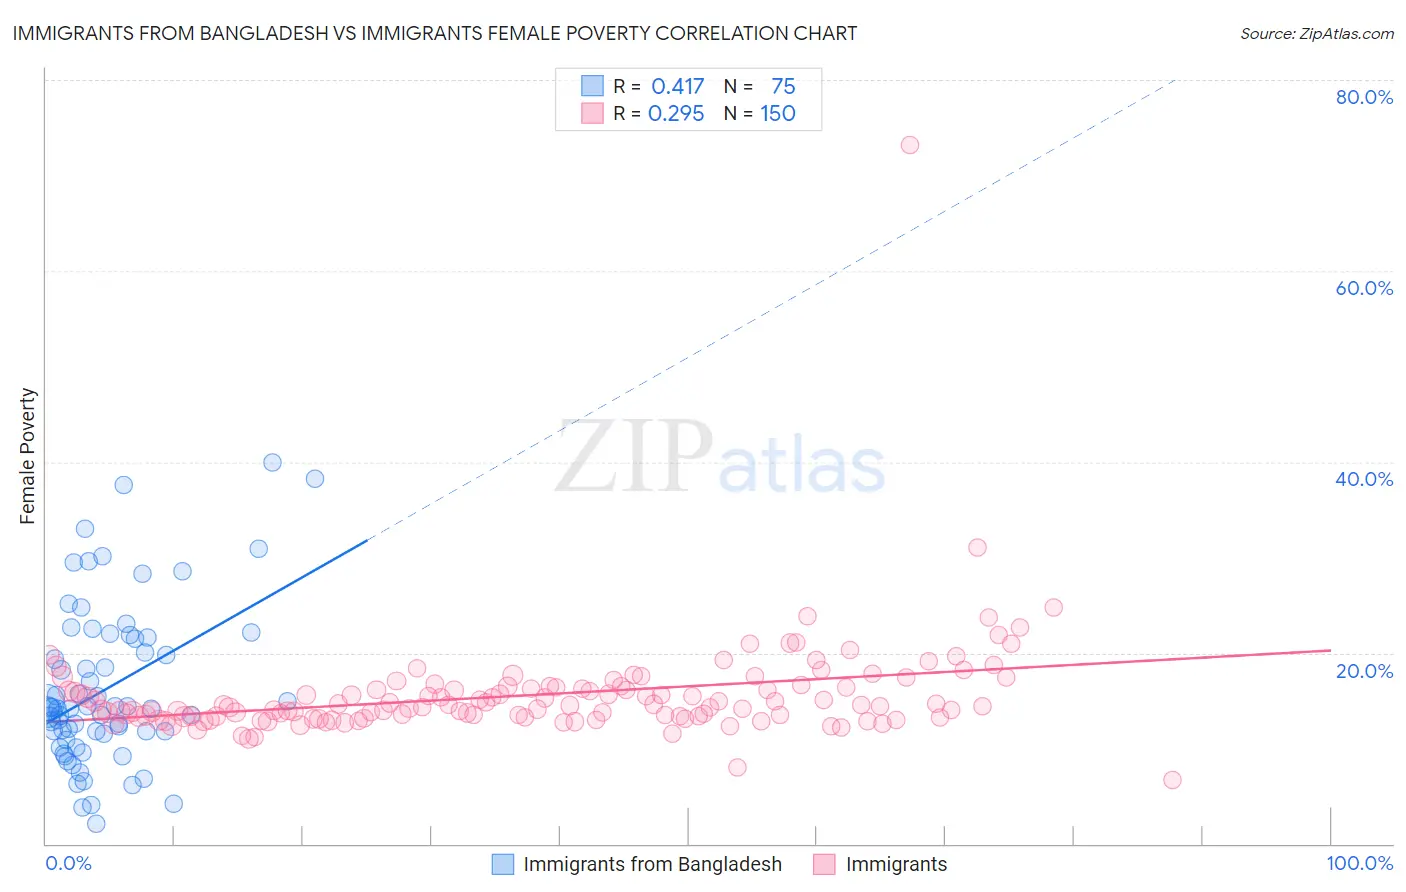
Immigrants from Bangladesh vs Immigrants Female Poverty Correlation Chart
The statistical analysis conducted on geographies consisting of 203,545,805 people shows a moderate positive correlation between the proportion of Immigrants from Bangladesh and poverty level among females in the United States with a correlation coefficient (R) of 0.417 and weighted average of 16.4%. Similarly, the statistical analysis conducted on geographies consisting of 576,347,863 people shows a weak positive correlation between the proportion of Immigrants and poverty level among females in the United States with a correlation coefficient (R) of 0.295 and weighted average of 14.4%, a difference of 13.6%.
Female Poverty Correlation Summary
| Measurement | Immigrants from Bangladesh | Immigrants |
| Minimum | 2.1% | 6.7% |
| Maximum | 39.9% | 73.1% |
| Range | 37.8% | 66.5% |
| Mean | 16.3% | 15.6% |
| Median | 14.2% | 14.4% |
| Interquartile 25% (IQ1) | 11.6% | 13.3% |
| Interquartile 75% (IQ3) | 21.6% | 16.4% |
| Interquartile Range (IQR) | 10.0% | 3.1% |
| Standard Deviation (Sample) | 8.3% | 5.6% |
| Standard Deviation (Population) | 8.3% | 5.6% |
Similar Demographics by Female Poverty
Demographics Similar to Immigrants from Bangladesh by Female Poverty
In terms of female poverty, the demographic groups most similar to Immigrants from Bangladesh are Yaqui (16.4%, a difference of 0.17%), Immigrants from Zaire (16.4%, a difference of 0.18%), Blackfeet (16.4%, a difference of 0.19%), Indonesian (16.4%, a difference of 0.20%), and Immigrants from Latin America (16.4%, a difference of 0.23%).
| Demographics | Rating | Rank | Female Poverty |
| Immigrants | Cuba | 0.0 /100 | #283 | Tragic 16.1% |
| Spanish Americans | 0.0 /100 | #284 | Tragic 16.2% |
| Comanche | 0.0 /100 | #285 | Tragic 16.2% |
| Inupiat | 0.0 /100 | #286 | Tragic 16.2% |
| Immigrants | Belize | 0.0 /100 | #287 | Tragic 16.3% |
| Indonesians | 0.0 /100 | #288 | Tragic 16.4% |
| Blackfeet | 0.0 /100 | #289 | Tragic 16.4% |
| Immigrants | Bangladesh | 0.0 /100 | #290 | Tragic 16.4% |
| Yaqui | 0.0 /100 | #291 | Tragic 16.4% |
| Immigrants | Zaire | 0.0 /100 | #292 | Tragic 16.4% |
| Immigrants | Latin America | 0.0 /100 | #293 | Tragic 16.4% |
| Immigrants | Cabo Verde | 0.0 /100 | #294 | Tragic 16.4% |
| Senegalese | 0.0 /100 | #295 | Tragic 16.5% |
| Immigrants | Senegal | 0.0 /100 | #296 | Tragic 16.5% |
| Mexicans | 0.0 /100 | #297 | Tragic 16.5% |
Demographics Similar to Immigrants by Female Poverty
In terms of female poverty, the demographic groups most similar to Immigrants are Immigrants from Thailand (14.4%, a difference of 0.030%), Immigrants from Uzbekistan (14.4%, a difference of 0.050%), Immigrants from Panama (14.4%, a difference of 0.12%), Japanese (14.5%, a difference of 0.19%), and Alsatian (14.5%, a difference of 0.23%).
| Demographics | Rating | Rank | Female Poverty |
| Malaysians | 7.4 /100 | #210 | Tragic 14.3% |
| Moroccans | 7.2 /100 | #211 | Tragic 14.3% |
| Bermudans | 5.5 /100 | #212 | Tragic 14.4% |
| Alaskan Athabascans | 5.3 /100 | #213 | Tragic 14.4% |
| Marshallese | 5.0 /100 | #214 | Tragic 14.4% |
| Immigrants | Panama | 4.7 /100 | #215 | Tragic 14.4% |
| Immigrants | Thailand | 4.5 /100 | #216 | Tragic 14.4% |
| Immigrants | Immigrants | 4.5 /100 | #217 | Tragic 14.4% |
| Immigrants | Uzbekistan | 4.4 /100 | #218 | Tragic 14.4% |
| Japanese | 4.1 /100 | #219 | Tragic 14.5% |
| Alsatians | 4.0 /100 | #220 | Tragic 14.5% |
| Immigrants | Cambodia | 3.7 /100 | #221 | Tragic 14.5% |
| Immigrants | Nonimmigrants | 3.7 /100 | #222 | Tragic 14.5% |
| Immigrants | Africa | 3.3 /100 | #223 | Tragic 14.5% |
| Americans | 2.8 /100 | #224 | Tragic 14.6% |