Immigrants from Bangladesh vs Czechoslovakian Female Poverty
COMPARE
Immigrants from Bangladesh
Czechoslovakian
Female Poverty
Female Poverty Comparison
Immigrants from Bangladesh
Czechoslovakians
16.4%
FEMALE POVERTY
0.0/ 100
METRIC RATING
290th/ 347
METRIC RANK
12.4%
FEMALE POVERTY
95.7/ 100
METRIC RATING
92nd/ 347
METRIC RANK
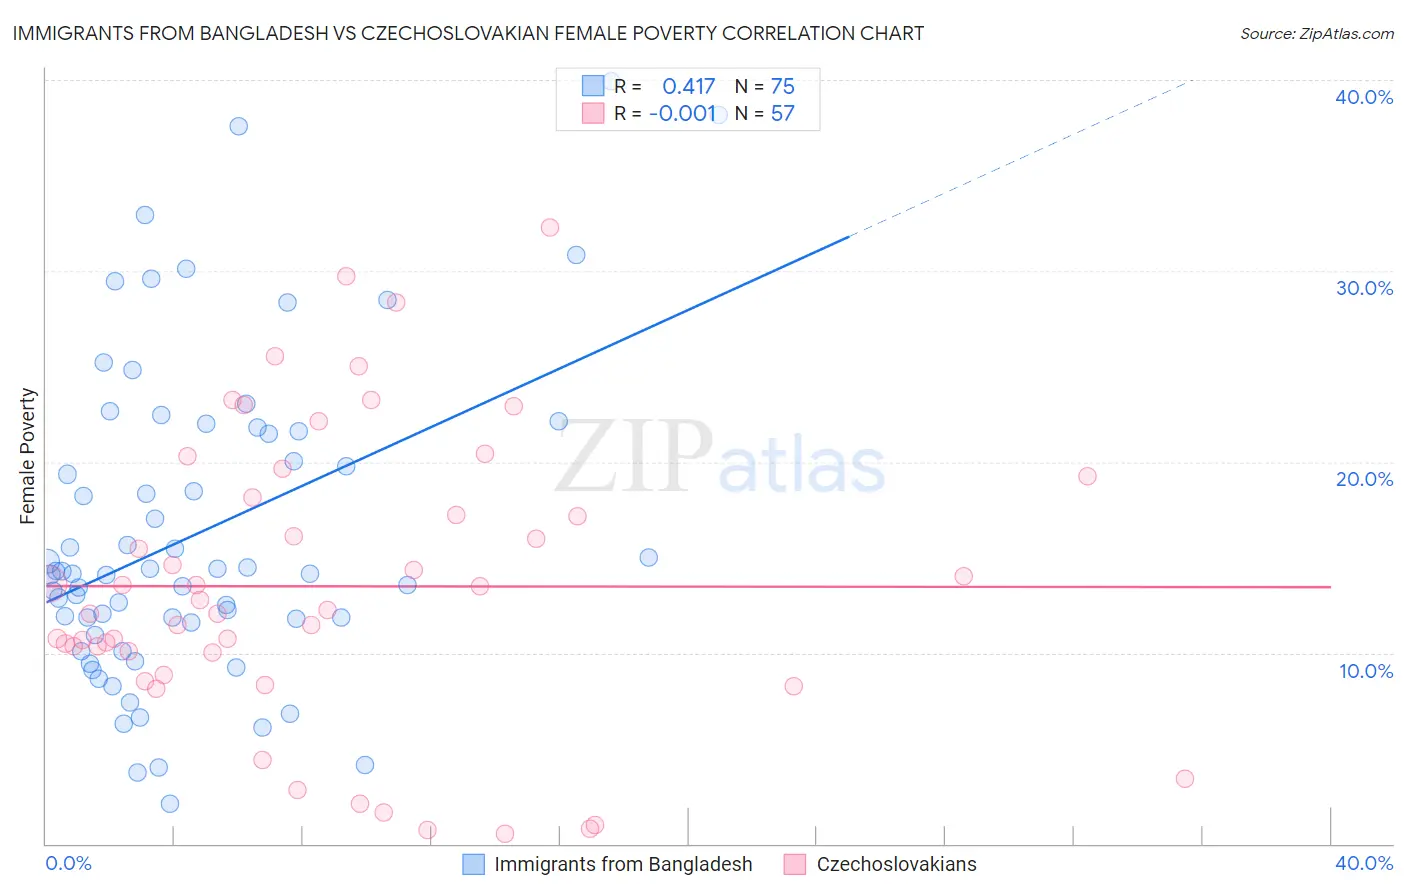
Immigrants from Bangladesh vs Czechoslovakian Female Poverty Correlation Chart
The statistical analysis conducted on geographies consisting of 203,545,805 people shows a moderate positive correlation between the proportion of Immigrants from Bangladesh and poverty level among females in the United States with a correlation coefficient (R) of 0.417 and weighted average of 16.4%. Similarly, the statistical analysis conducted on geographies consisting of 368,467,863 people shows no correlation between the proportion of Czechoslovakians and poverty level among females in the United States with a correlation coefficient (R) of -0.001 and weighted average of 12.4%, a difference of 31.9%.
Female Poverty Correlation Summary
| Measurement | Immigrants from Bangladesh | Czechoslovakian |
| Minimum | 2.1% | 0.52% |
| Maximum | 39.9% | 32.3% |
| Range | 37.8% | 31.8% |
| Mean | 16.3% | 13.5% |
| Median | 14.2% | 12.3% |
| Interquartile 25% (IQ1) | 11.6% | 9.4% |
| Interquartile 75% (IQ3) | 21.6% | 18.7% |
| Interquartile Range (IQR) | 10.0% | 9.3% |
| Standard Deviation (Sample) | 8.3% | 7.6% |
| Standard Deviation (Population) | 8.3% | 7.5% |
Similar Demographics by Female Poverty
Demographics Similar to Immigrants from Bangladesh by Female Poverty
In terms of female poverty, the demographic groups most similar to Immigrants from Bangladesh are Yaqui (16.4%, a difference of 0.17%), Immigrants from Zaire (16.4%, a difference of 0.18%), Blackfeet (16.4%, a difference of 0.19%), Indonesian (16.4%, a difference of 0.20%), and Immigrants from Latin America (16.4%, a difference of 0.23%).
| Demographics | Rating | Rank | Female Poverty |
| Immigrants | Cuba | 0.0 /100 | #283 | Tragic 16.1% |
| Spanish Americans | 0.0 /100 | #284 | Tragic 16.2% |
| Comanche | 0.0 /100 | #285 | Tragic 16.2% |
| Inupiat | 0.0 /100 | #286 | Tragic 16.2% |
| Immigrants | Belize | 0.0 /100 | #287 | Tragic 16.3% |
| Indonesians | 0.0 /100 | #288 | Tragic 16.4% |
| Blackfeet | 0.0 /100 | #289 | Tragic 16.4% |
| Immigrants | Bangladesh | 0.0 /100 | #290 | Tragic 16.4% |
| Yaqui | 0.0 /100 | #291 | Tragic 16.4% |
| Immigrants | Zaire | 0.0 /100 | #292 | Tragic 16.4% |
| Immigrants | Latin America | 0.0 /100 | #293 | Tragic 16.4% |
| Immigrants | Cabo Verde | 0.0 /100 | #294 | Tragic 16.4% |
| Senegalese | 0.0 /100 | #295 | Tragic 16.5% |
| Immigrants | Senegal | 0.0 /100 | #296 | Tragic 16.5% |
| Mexicans | 0.0 /100 | #297 | Tragic 16.5% |
Demographics Similar to Czechoslovakians by Female Poverty
In terms of female poverty, the demographic groups most similar to Czechoslovakians are Belgian (12.4%, a difference of 0.010%), Immigrants from Denmark (12.4%, a difference of 0.020%), Immigrants from Egypt (12.5%, a difference of 0.17%), Immigrants from Indonesia (12.5%, a difference of 0.20%), and English (12.4%, a difference of 0.24%).
| Demographics | Rating | Rank | Female Poverty |
| Irish | 96.5 /100 | #85 | Exceptional 12.4% |
| Dutch | 96.5 /100 | #86 | Exceptional 12.4% |
| Okinawans | 96.4 /100 | #87 | Exceptional 12.4% |
| Finns | 96.4 /100 | #88 | Exceptional 12.4% |
| English | 96.1 /100 | #89 | Exceptional 12.4% |
| Immigrants | Denmark | 95.8 /100 | #90 | Exceptional 12.4% |
| Belgians | 95.8 /100 | #91 | Exceptional 12.4% |
| Czechoslovakians | 95.7 /100 | #92 | Exceptional 12.4% |
| Immigrants | Egypt | 95.5 /100 | #93 | Exceptional 12.5% |
| Immigrants | Indonesia | 95.4 /100 | #94 | Exceptional 12.5% |
| Immigrants | South Africa | 95.4 /100 | #95 | Exceptional 12.5% |
| British | 95.2 /100 | #96 | Exceptional 12.5% |
| Australians | 95.2 /100 | #97 | Exceptional 12.5% |
| Native Hawaiians | 95.1 /100 | #98 | Exceptional 12.5% |
| Romanians | 95.1 /100 | #99 | Exceptional 12.5% |