Immigrants from Armenia vs Black/African American Receiving Food Stamps
COMPARE
Immigrants from Armenia
Black/African American
Receiving Food Stamps
Receiving Food Stamps Comparison
Immigrants from Armenia
Blacks/African Americans
13.0%
RECEIVING FOOD STAMPS
4.3/ 100
METRIC RATING
224th/ 347
METRIC RANK
17.2%
RECEIVING FOOD STAMPS
0.0/ 100
METRIC RATING
317th/ 347
METRIC RANK
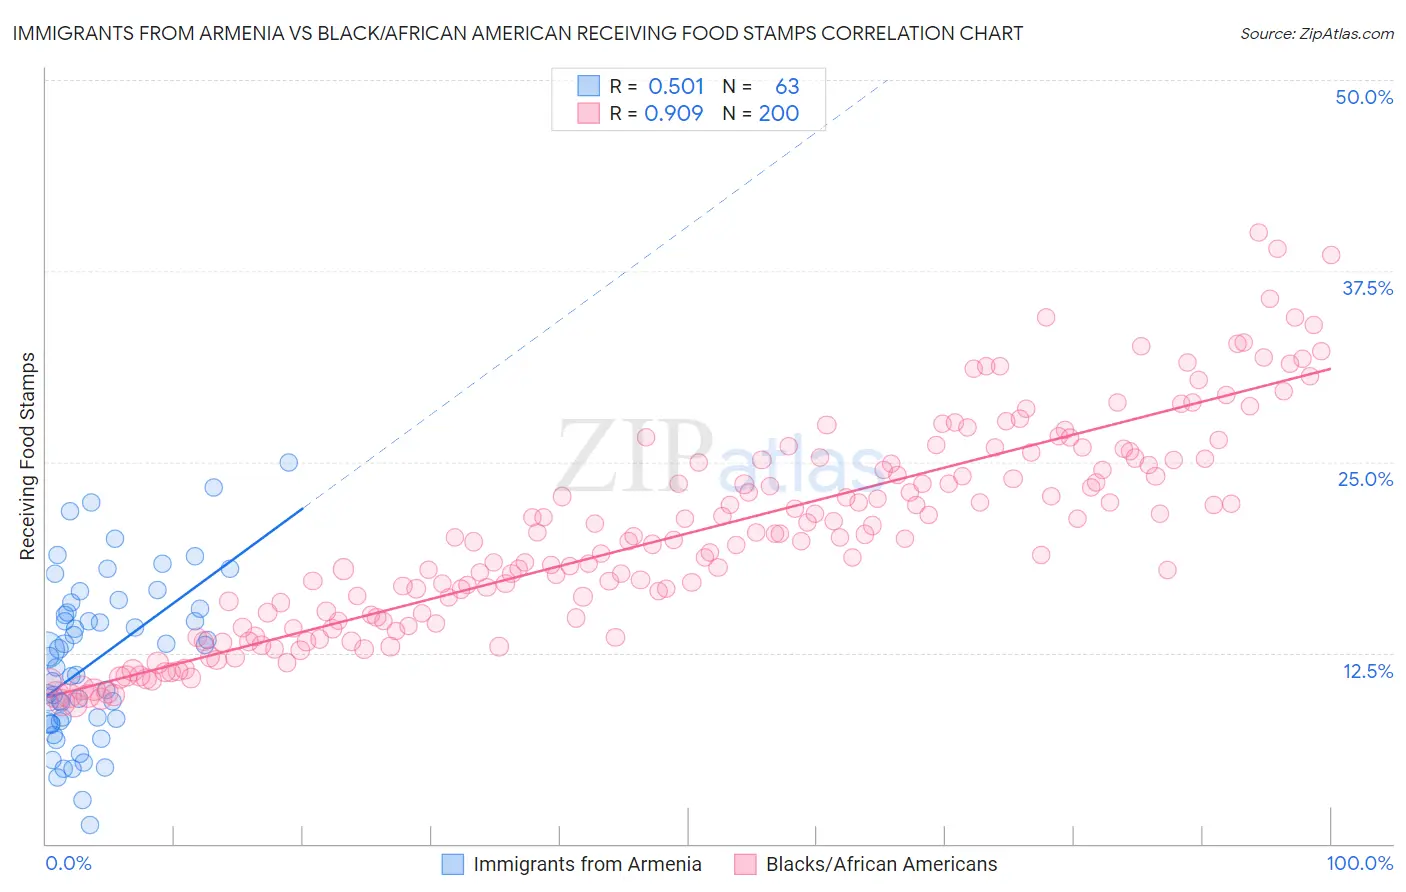
Immigrants from Armenia vs Black/African American Receiving Food Stamps Correlation Chart
The statistical analysis conducted on geographies consisting of 97,612,331 people shows a substantial positive correlation between the proportion of Immigrants from Armenia and percentage of population receiving government assistance and/or food stamps in the United States with a correlation coefficient (R) of 0.501 and weighted average of 13.0%. Similarly, the statistical analysis conducted on geographies consisting of 562,963,519 people shows a near-perfect positive correlation between the proportion of Blacks/African Americans and percentage of population receiving government assistance and/or food stamps in the United States with a correlation coefficient (R) of 0.909 and weighted average of 17.2%, a difference of 31.9%.
Receiving Food Stamps Correlation Summary
| Measurement | Immigrants from Armenia | Black/African American |
| Minimum | 1.2% | 9.1% |
| Maximum | 25.0% | 40.0% |
| Range | 23.8% | 31.0% |
| Mean | 12.1% | 20.3% |
| Median | 12.2% | 20.0% |
| Interquartile 25% (IQ1) | 8.0% | 14.7% |
| Interquartile 75% (IQ3) | 15.4% | 25.0% |
| Interquartile Range (IQR) | 7.4% | 10.3% |
| Standard Deviation (Sample) | 5.3% | 6.8% |
| Standard Deviation (Population) | 5.2% | 6.8% |
Similar Demographics by Receiving Food Stamps
Demographics Similar to Immigrants from Armenia by Receiving Food Stamps
In terms of receiving food stamps, the demographic groups most similar to Immigrants from Armenia are Fijian (13.0%, a difference of 0.020%), Immigrants from Albania (13.0%, a difference of 0.070%), Immigrants (13.0%, a difference of 0.11%), Bermudan (13.0%, a difference of 0.37%), and Chickasaw (13.1%, a difference of 0.62%).
| Demographics | Rating | Rank | Receiving Food Stamps |
| Immigrants | Burma/Myanmar | 6.0 /100 | #217 | Tragic 12.9% |
| Hawaiians | 5.4 /100 | #218 | Tragic 12.9% |
| Immigrants | Middle Africa | 5.4 /100 | #219 | Tragic 12.9% |
| Immigrants | Colombia | 5.3 /100 | #220 | Tragic 12.9% |
| Bermudans | 4.8 /100 | #221 | Tragic 13.0% |
| Immigrants | Immigrants | 4.4 /100 | #222 | Tragic 13.0% |
| Immigrants | Albania | 4.4 /100 | #223 | Tragic 13.0% |
| Immigrants | Armenia | 4.3 /100 | #224 | Tragic 13.0% |
| Fijians | 4.3 /100 | #225 | Tragic 13.0% |
| Chickasaw | 3.6 /100 | #226 | Tragic 13.1% |
| Nigerians | 3.5 /100 | #227 | Tragic 13.1% |
| Panamanians | 3.5 /100 | #228 | Tragic 13.1% |
| Ottawa | 3.5 /100 | #229 | Tragic 13.1% |
| Puget Sound Salish | 3.4 /100 | #230 | Tragic 13.1% |
| Immigrants | Nigeria | 3.4 /100 | #231 | Tragic 13.1% |
Demographics Similar to Blacks/African Americans by Receiving Food Stamps
In terms of receiving food stamps, the demographic groups most similar to Blacks/African Americans are Menominee (17.2%, a difference of 0.17%), Immigrants from St. Vincent and the Grenadines (17.2%, a difference of 0.35%), Immigrants from Nicaragua (17.2%, a difference of 0.43%), Central American Indian (17.1%, a difference of 0.53%), and Native/Alaskan (17.3%, a difference of 0.62%).
| Demographics | Rating | Rank | Receiving Food Stamps |
| Immigrants | Barbados | 0.0 /100 | #310 | Tragic 16.6% |
| Guyanese | 0.0 /100 | #311 | Tragic 16.7% |
| Sioux | 0.0 /100 | #312 | Tragic 16.8% |
| Immigrants | Jamaica | 0.0 /100 | #313 | Tragic 16.9% |
| Immigrants | Guyana | 0.0 /100 | #314 | Tragic 16.9% |
| Bahamians | 0.0 /100 | #315 | Tragic 17.0% |
| Central American Indians | 0.0 /100 | #316 | Tragic 17.1% |
| Blacks/African Americans | 0.0 /100 | #317 | Tragic 17.2% |
| Menominee | 0.0 /100 | #318 | Tragic 17.2% |
| Immigrants | St. Vincent and the Grenadines | 0.0 /100 | #319 | Tragic 17.2% |
| Immigrants | Nicaragua | 0.0 /100 | #320 | Tragic 17.2% |
| Natives/Alaskans | 0.0 /100 | #321 | Tragic 17.3% |
| Immigrants | Grenada | 0.0 /100 | #322 | Tragic 17.8% |
| Haitians | 0.0 /100 | #323 | Tragic 17.8% |
| British West Indians | 0.0 /100 | #324 | Tragic 17.9% |