Immigrants from Africa vs Immigrants from France Single Father Poverty
COMPARE
Immigrants from Africa
Immigrants from France
Single Father Poverty
Single Father Poverty Comparison
Immigrants from Africa
Immigrants from France
15.8%
SINGLE FATHER POVERTY
95.1/ 100
METRIC RATING
110th/ 347
METRIC RANK
16.1%
SINGLE FATHER POVERTY
73.1/ 100
METRIC RATING
151st/ 347
METRIC RANK
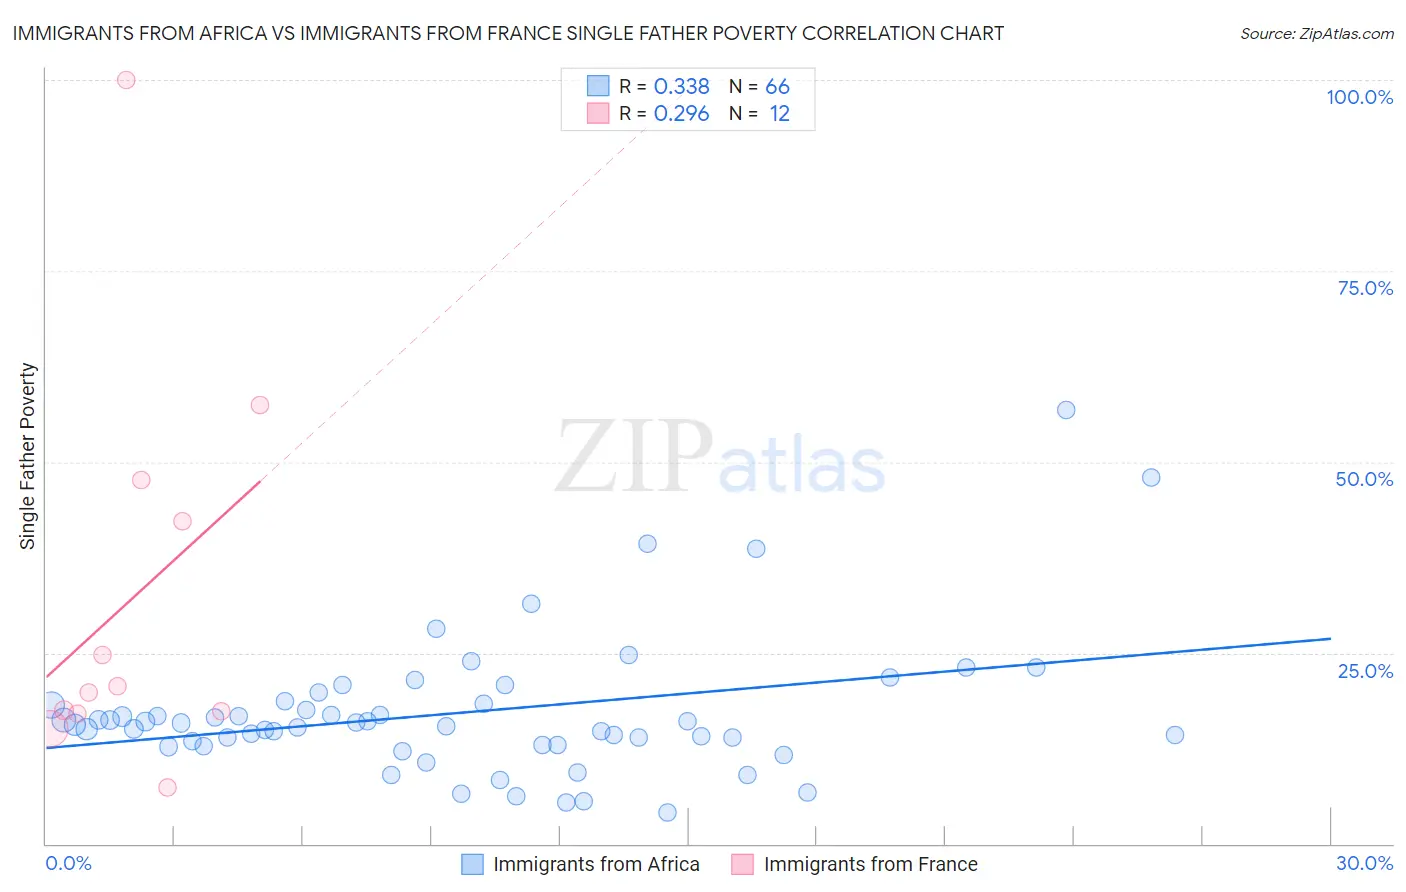
Immigrants from Africa vs Immigrants from France Single Father Poverty Correlation Chart
The statistical analysis conducted on geographies consisting of 360,154,757 people shows a mild positive correlation between the proportion of Immigrants from Africa and poverty level among single fathers in the United States with a correlation coefficient (R) of 0.338 and weighted average of 15.8%. Similarly, the statistical analysis conducted on geographies consisting of 232,790,194 people shows a weak positive correlation between the proportion of Immigrants from France and poverty level among single fathers in the United States with a correlation coefficient (R) of 0.296 and weighted average of 16.1%, a difference of 2.2%.
Single Father Poverty Correlation Summary
| Measurement | Immigrants from Africa | Immigrants from France |
| Minimum | 4.1% | 7.4% |
| Maximum | 56.8% | 100.0% |
| Range | 52.7% | 92.6% |
| Mean | 17.1% | 32.2% |
| Median | 15.7% | 20.2% |
| Interquartile 25% (IQ1) | 13.0% | 17.2% |
| Interquartile 75% (IQ3) | 18.3% | 45.0% |
| Interquartile Range (IQR) | 5.3% | 27.8% |
| Standard Deviation (Sample) | 9.1% | 26.1% |
| Standard Deviation (Population) | 9.0% | 25.0% |
Similar Demographics by Single Father Poverty
Demographics Similar to Immigrants from Africa by Single Father Poverty
In terms of single father poverty, the demographic groups most similar to Immigrants from Africa are Turkish (15.8%, a difference of 0.010%), Bulgarian (15.8%, a difference of 0.050%), Immigrants from Latvia (15.8%, a difference of 0.080%), Danish (15.8%, a difference of 0.13%), and Argentinean (15.8%, a difference of 0.14%).
| Demographics | Rating | Rank | Single Father Poverty |
| South American Indians | 96.2 /100 | #103 | Exceptional 15.7% |
| Australians | 96.1 /100 | #104 | Exceptional 15.7% |
| Immigrants | Australia | 96.1 /100 | #105 | Exceptional 15.7% |
| Immigrants | Poland | 95.8 /100 | #106 | Exceptional 15.7% |
| Native Hawaiians | 95.8 /100 | #107 | Exceptional 15.7% |
| Pakistanis | 95.7 /100 | #108 | Exceptional 15.7% |
| Turks | 95.1 /100 | #109 | Exceptional 15.8% |
| Immigrants | Africa | 95.1 /100 | #110 | Exceptional 15.8% |
| Bulgarians | 94.8 /100 | #111 | Exceptional 15.8% |
| Immigrants | Latvia | 94.7 /100 | #112 | Exceptional 15.8% |
| Danes | 94.5 /100 | #113 | Exceptional 15.8% |
| Argentineans | 94.4 /100 | #114 | Exceptional 15.8% |
| Immigrants | Thailand | 93.6 /100 | #115 | Exceptional 15.8% |
| Immigrants | Argentina | 92.8 /100 | #116 | Exceptional 15.8% |
| Immigrants | Colombia | 92.6 /100 | #117 | Exceptional 15.8% |
Demographics Similar to Immigrants from France by Single Father Poverty
In terms of single father poverty, the demographic groups most similar to Immigrants from France are Jordanian (16.1%, a difference of 0.060%), Immigrants from Zimbabwe (16.1%, a difference of 0.060%), Immigrants from Israel (16.1%, a difference of 0.060%), South African (16.1%, a difference of 0.12%), and Mexican (16.1%, a difference of 0.16%).
| Demographics | Rating | Rank | Single Father Poverty |
| Immigrants | Kuwait | 81.4 /100 | #144 | Excellent 16.0% |
| Immigrants | Western Asia | 80.7 /100 | #145 | Excellent 16.0% |
| Immigrants | Hungary | 78.3 /100 | #146 | Good 16.1% |
| Colombians | 77.1 /100 | #147 | Good 16.1% |
| Nigerians | 76.8 /100 | #148 | Good 16.1% |
| South Africans | 75.1 /100 | #149 | Good 16.1% |
| Jordanians | 74.2 /100 | #150 | Good 16.1% |
| Immigrants | France | 73.1 /100 | #151 | Good 16.1% |
| Immigrants | Zimbabwe | 72.1 /100 | #152 | Good 16.1% |
| Immigrants | Israel | 72.0 /100 | #153 | Good 16.1% |
| Mexicans | 70.1 /100 | #154 | Good 16.1% |
| Immigrants | Nicaragua | 67.8 /100 | #155 | Good 16.2% |
| Immigrants | Jordan | 66.0 /100 | #156 | Good 16.2% |
| Immigrants | Czechoslovakia | 62.8 /100 | #157 | Good 16.2% |
| Portuguese | 62.3 /100 | #158 | Good 16.2% |