Icelander vs Russian Single Father Poverty
COMPARE
Icelander
Russian
Single Father Poverty
Single Father Poverty Comparison
Icelanders
Russians
14.5%
SINGLE FATHER POVERTY
100.0/ 100
METRIC RATING
31st/ 347
METRIC RANK
16.4%
SINGLE FATHER POVERTY
30.1/ 100
METRIC RATING
188th/ 347
METRIC RANK
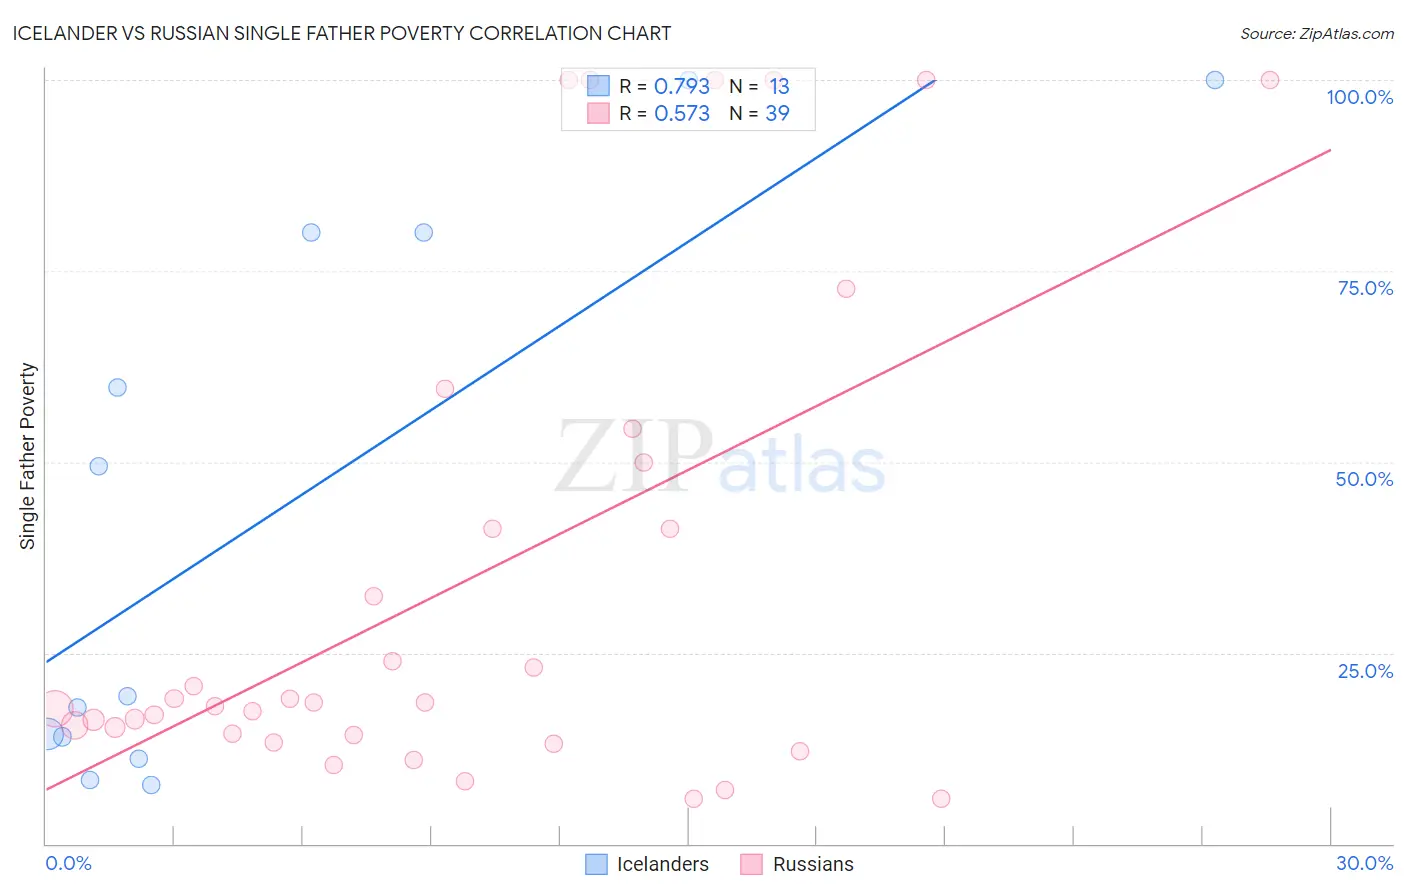
Icelander vs Russian Single Father Poverty Correlation Chart
The statistical analysis conducted on geographies consisting of 135,441,299 people shows a strong positive correlation between the proportion of Icelanders and poverty level among single fathers in the United States with a correlation coefficient (R) of 0.793 and weighted average of 14.5%. Similarly, the statistical analysis conducted on geographies consisting of 378,661,966 people shows a substantial positive correlation between the proportion of Russians and poverty level among single fathers in the United States with a correlation coefficient (R) of 0.573 and weighted average of 16.4%, a difference of 13.1%.
Single Father Poverty Correlation Summary
| Measurement | Icelander | Russian |
| Minimum | 7.7% | 5.9% |
| Maximum | 100.0% | 100.0% |
| Range | 92.3% | 94.1% |
| Mean | 43.2% | 34.4% |
| Median | 19.3% | 18.4% |
| Interquartile 25% (IQ1) | 12.6% | 14.2% |
| Interquartile 75% (IQ3) | 80.0% | 50.0% |
| Interquartile Range (IQR) | 67.4% | 35.8% |
| Standard Deviation (Sample) | 36.4% | 32.0% |
| Standard Deviation (Population) | 34.9% | 31.6% |
Similar Demographics by Single Father Poverty
Demographics Similar to Icelanders by Single Father Poverty
In terms of single father poverty, the demographic groups most similar to Icelanders are Thai (14.5%, a difference of 0.080%), Somali (14.5%, a difference of 0.13%), Asian (14.6%, a difference of 0.15%), Immigrants from South Central Asia (14.5%, a difference of 0.23%), and Okinawan (14.6%, a difference of 0.71%).
| Demographics | Rating | Rank | Single Father Poverty |
| Immigrants | South Eastern Asia | 100.0 /100 | #24 | Exceptional 14.4% |
| Iranians | 100.0 /100 | #25 | Exceptional 14.4% |
| Spanish American Indians | 100.0 /100 | #26 | Exceptional 14.4% |
| Nepalese | 100.0 /100 | #27 | Exceptional 14.4% |
| Immigrants | South Central Asia | 100.0 /100 | #28 | Exceptional 14.5% |
| Somalis | 100.0 /100 | #29 | Exceptional 14.5% |
| Thais | 100.0 /100 | #30 | Exceptional 14.5% |
| Icelanders | 100.0 /100 | #31 | Exceptional 14.5% |
| Asians | 100.0 /100 | #32 | Exceptional 14.6% |
| Okinawans | 100.0 /100 | #33 | Exceptional 14.6% |
| Egyptians | 100.0 /100 | #34 | Exceptional 14.7% |
| Immigrants | Bolivia | 100.0 /100 | #35 | Exceptional 14.7% |
| Immigrants | Indonesia | 100.0 /100 | #36 | Exceptional 14.7% |
| Immigrants | Eastern Africa | 100.0 /100 | #37 | Exceptional 14.7% |
| Bolivians | 100.0 /100 | #38 | Exceptional 14.7% |
Demographics Similar to Russians by Single Father Poverty
In terms of single father poverty, the demographic groups most similar to Russians are Ukrainian (16.4%, a difference of 0.020%), Immigrants from Venezuela (16.4%, a difference of 0.050%), Latvian (16.5%, a difference of 0.060%), Immigrants from Burma/Myanmar (16.5%, a difference of 0.11%), and Immigrants from Guyana (16.5%, a difference of 0.16%).
| Demographics | Rating | Rank | Single Father Poverty |
| Immigrants | Western Africa | 36.0 /100 | #181 | Fair 16.4% |
| Immigrants | Italy | 35.7 /100 | #182 | Fair 16.4% |
| Aleuts | 35.3 /100 | #183 | Fair 16.4% |
| Cambodians | 34.6 /100 | #184 | Fair 16.4% |
| Panamanians | 33.6 /100 | #185 | Fair 16.4% |
| Immigrants | Venezuela | 31.0 /100 | #186 | Fair 16.4% |
| Ukrainians | 30.4 /100 | #187 | Fair 16.4% |
| Russians | 30.1 /100 | #188 | Fair 16.4% |
| Latvians | 28.9 /100 | #189 | Fair 16.5% |
| Immigrants | Burma/Myanmar | 28.0 /100 | #190 | Fair 16.5% |
| Immigrants | Guyana | 27.1 /100 | #191 | Fair 16.5% |
| Immigrants | Switzerland | 24.8 /100 | #192 | Fair 16.5% |
| Ecuadorians | 24.5 /100 | #193 | Fair 16.5% |
| Cape Verdeans | 24.4 /100 | #194 | Fair 16.5% |
| Immigrants | Barbados | 24.3 /100 | #195 | Fair 16.5% |