Bolivian vs Russian Single Father Poverty
COMPARE
Bolivian
Russian
Single Father Poverty
Single Father Poverty Comparison
Bolivians
Russians
14.7%
SINGLE FATHER POVERTY
100.0/ 100
METRIC RATING
38th/ 347
METRIC RANK
16.4%
SINGLE FATHER POVERTY
30.1/ 100
METRIC RATING
188th/ 347
METRIC RANK
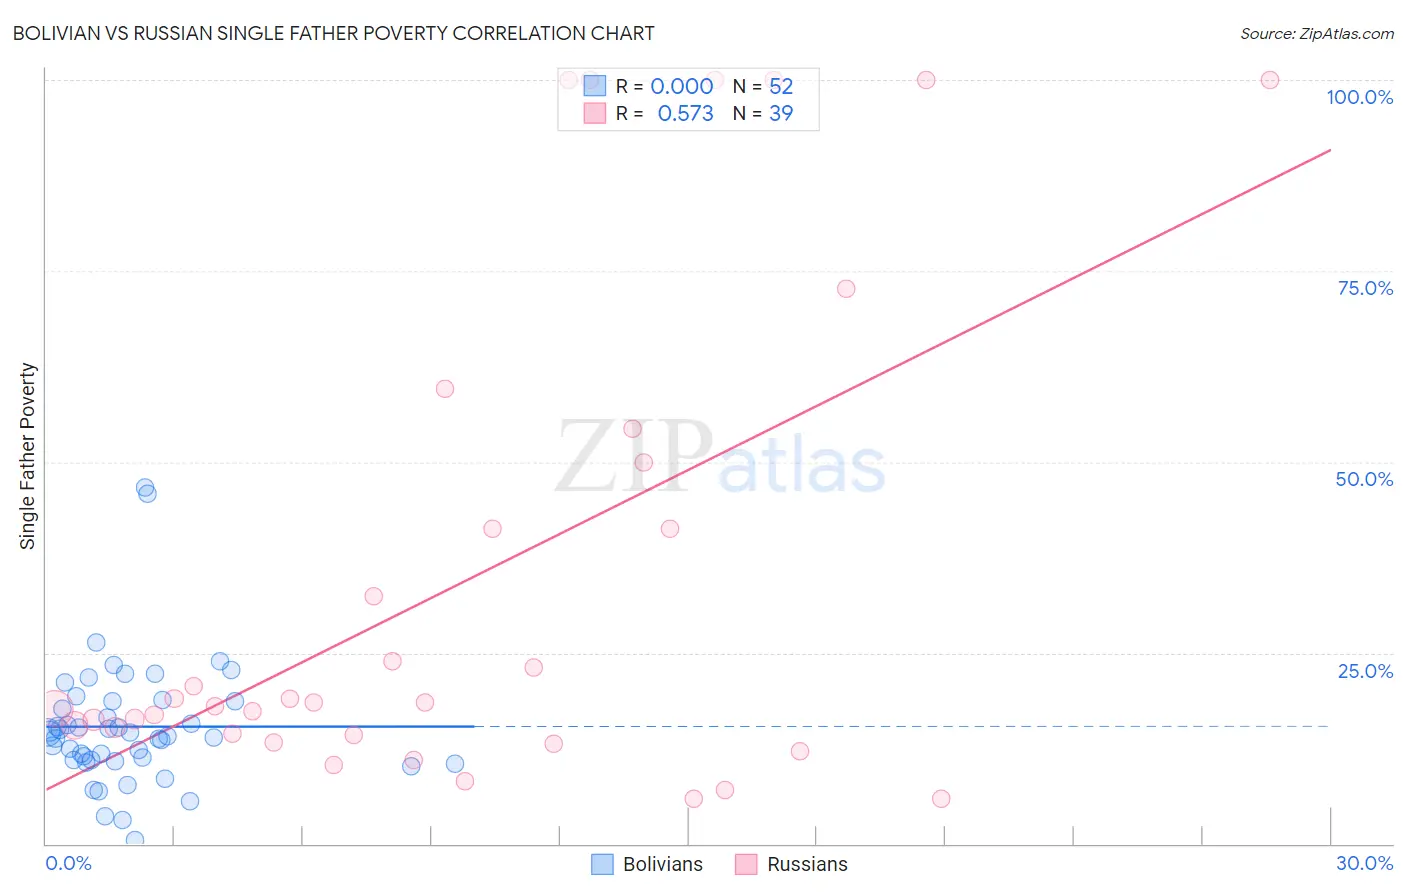
Bolivian vs Russian Single Father Poverty Correlation Chart
The statistical analysis conducted on geographies consisting of 157,877,648 people shows no correlation between the proportion of Bolivians and poverty level among single fathers in the United States with a correlation coefficient (R) of 0.000 and weighted average of 14.7%. Similarly, the statistical analysis conducted on geographies consisting of 378,661,966 people shows a substantial positive correlation between the proportion of Russians and poverty level among single fathers in the United States with a correlation coefficient (R) of 0.573 and weighted average of 16.4%, a difference of 11.8%.
Single Father Poverty Correlation Summary
| Measurement | Bolivian | Russian |
| Minimum | 0.47% | 5.9% |
| Maximum | 46.7% | 100.0% |
| Range | 46.2% | 94.1% |
| Mean | 15.3% | 34.4% |
| Median | 14.3% | 18.4% |
| Interquartile 25% (IQ1) | 10.9% | 14.2% |
| Interquartile 75% (IQ3) | 18.6% | 50.0% |
| Interquartile Range (IQR) | 7.7% | 35.8% |
| Standard Deviation (Sample) | 8.3% | 32.0% |
| Standard Deviation (Population) | 8.2% | 31.6% |
Similar Demographics by Single Father Poverty
Demographics Similar to Bolivians by Single Father Poverty
In terms of single father poverty, the demographic groups most similar to Bolivians are Immigrants from Eastern Africa (14.7%, a difference of 0.010%), Immigrants from Indonesia (14.7%, a difference of 0.14%), Immigrants from Asia (14.7%, a difference of 0.18%), Immigrants from Bolivia (14.7%, a difference of 0.30%), and Egyptian (14.7%, a difference of 0.37%).
| Demographics | Rating | Rank | Single Father Poverty |
| Icelanders | 100.0 /100 | #31 | Exceptional 14.5% |
| Asians | 100.0 /100 | #32 | Exceptional 14.6% |
| Okinawans | 100.0 /100 | #33 | Exceptional 14.6% |
| Egyptians | 100.0 /100 | #34 | Exceptional 14.7% |
| Immigrants | Bolivia | 100.0 /100 | #35 | Exceptional 14.7% |
| Immigrants | Indonesia | 100.0 /100 | #36 | Exceptional 14.7% |
| Immigrants | Eastern Africa | 100.0 /100 | #37 | Exceptional 14.7% |
| Bolivians | 100.0 /100 | #38 | Exceptional 14.7% |
| Immigrants | Asia | 100.0 /100 | #39 | Exceptional 14.7% |
| Pima | 100.0 /100 | #40 | Exceptional 14.8% |
| Indians (Asian) | 100.0 /100 | #41 | Exceptional 14.8% |
| Immigrants | Nepal | 100.0 /100 | #42 | Exceptional 14.8% |
| Immigrants | Eritrea | 100.0 /100 | #43 | Exceptional 14.8% |
| Salvadorans | 100.0 /100 | #44 | Exceptional 14.9% |
| Immigrants | Somalia | 100.0 /100 | #45 | Exceptional 14.9% |
Demographics Similar to Russians by Single Father Poverty
In terms of single father poverty, the demographic groups most similar to Russians are Ukrainian (16.4%, a difference of 0.020%), Immigrants from Venezuela (16.4%, a difference of 0.050%), Latvian (16.5%, a difference of 0.060%), Immigrants from Burma/Myanmar (16.5%, a difference of 0.11%), and Immigrants from Guyana (16.5%, a difference of 0.16%).
| Demographics | Rating | Rank | Single Father Poverty |
| Immigrants | Western Africa | 36.0 /100 | #181 | Fair 16.4% |
| Immigrants | Italy | 35.7 /100 | #182 | Fair 16.4% |
| Aleuts | 35.3 /100 | #183 | Fair 16.4% |
| Cambodians | 34.6 /100 | #184 | Fair 16.4% |
| Panamanians | 33.6 /100 | #185 | Fair 16.4% |
| Immigrants | Venezuela | 31.0 /100 | #186 | Fair 16.4% |
| Ukrainians | 30.4 /100 | #187 | Fair 16.4% |
| Russians | 30.1 /100 | #188 | Fair 16.4% |
| Latvians | 28.9 /100 | #189 | Fair 16.5% |
| Immigrants | Burma/Myanmar | 28.0 /100 | #190 | Fair 16.5% |
| Immigrants | Guyana | 27.1 /100 | #191 | Fair 16.5% |
| Immigrants | Switzerland | 24.8 /100 | #192 | Fair 16.5% |
| Ecuadorians | 24.5 /100 | #193 | Fair 16.5% |
| Cape Verdeans | 24.4 /100 | #194 | Fair 16.5% |
| Immigrants | Barbados | 24.3 /100 | #195 | Fair 16.5% |