Chilean vs Russian Single Father Poverty
COMPARE
Chilean
Russian
Single Father Poverty
Single Father Poverty Comparison
Chileans
Russians
15.7%
SINGLE FATHER POVERTY
96.4/ 100
METRIC RATING
102nd/ 347
METRIC RANK
16.4%
SINGLE FATHER POVERTY
30.1/ 100
METRIC RATING
188th/ 347
METRIC RANK
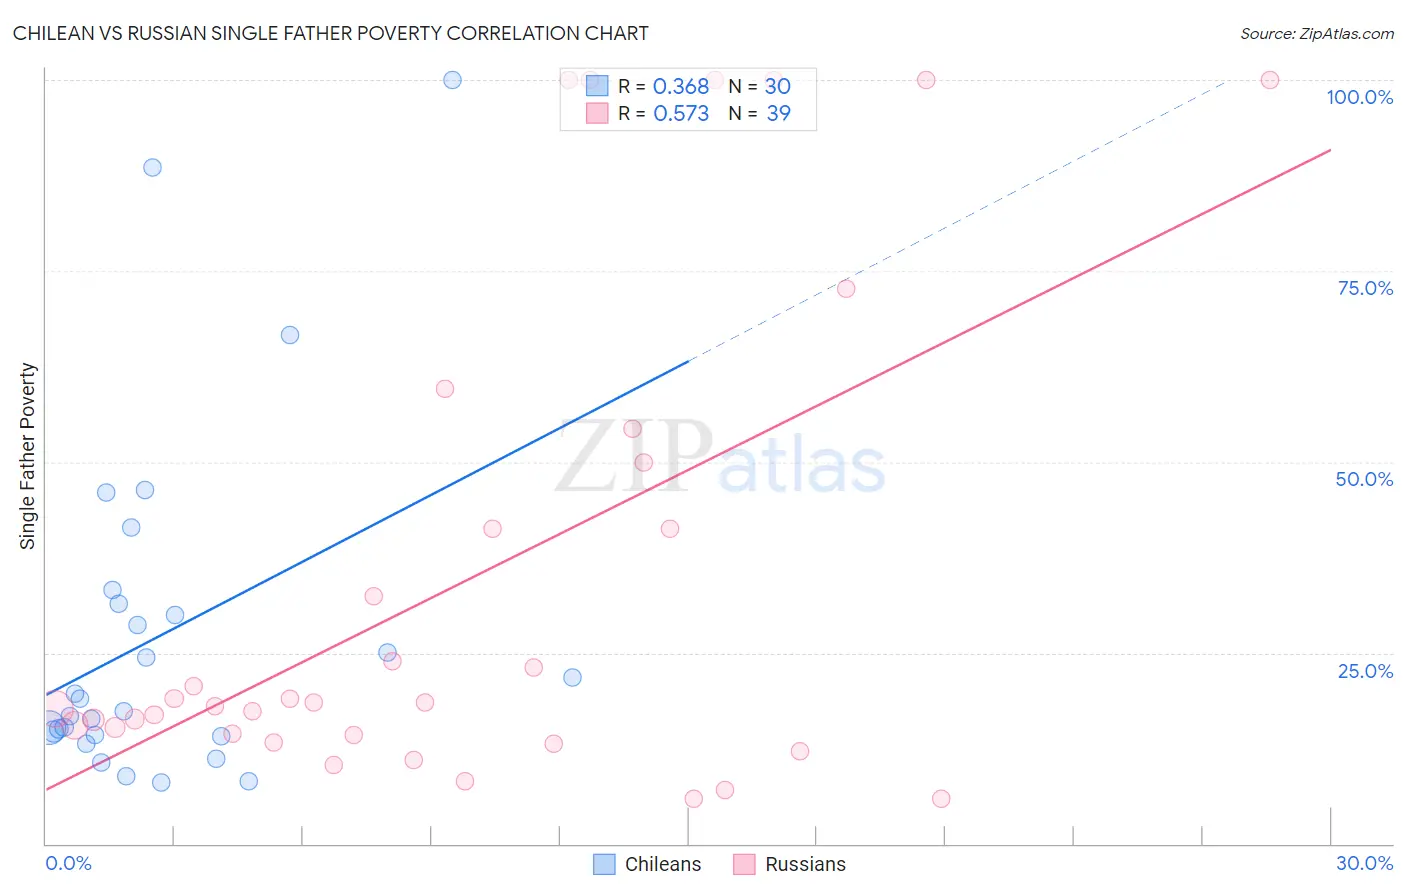
Chilean vs Russian Single Father Poverty Correlation Chart
The statistical analysis conducted on geographies consisting of 214,217,238 people shows a mild positive correlation between the proportion of Chileans and poverty level among single fathers in the United States with a correlation coefficient (R) of 0.368 and weighted average of 15.7%. Similarly, the statistical analysis conducted on geographies consisting of 378,661,966 people shows a substantial positive correlation between the proportion of Russians and poverty level among single fathers in the United States with a correlation coefficient (R) of 0.573 and weighted average of 16.4%, a difference of 4.7%.
Single Father Poverty Correlation Summary
| Measurement | Chilean | Russian |
| Minimum | 8.0% | 5.9% |
| Maximum | 100.0% | 100.0% |
| Range | 92.0% | 94.1% |
| Mean | 27.3% | 34.4% |
| Median | 18.2% | 18.4% |
| Interquartile 25% (IQ1) | 14.2% | 14.2% |
| Interquartile 75% (IQ3) | 31.4% | 50.0% |
| Interquartile Range (IQR) | 17.2% | 35.8% |
| Standard Deviation (Sample) | 22.6% | 32.0% |
| Standard Deviation (Population) | 22.2% | 31.6% |
Similar Demographics by Single Father Poverty
Demographics Similar to Chileans by Single Father Poverty
In terms of single father poverty, the demographic groups most similar to Chileans are South American Indian (15.7%, a difference of 0.060%), Australian (15.7%, a difference of 0.080%), Immigrants from Australia (15.7%, a difference of 0.10%), Fijian (15.7%, a difference of 0.16%), and Immigrants from Poland (15.7%, a difference of 0.17%).
| Demographics | Rating | Rank | Single Father Poverty |
| Immigrants | Kazakhstan | 98.2 /100 | #95 | Exceptional 15.6% |
| Immigrants | Belgium | 98.1 /100 | #96 | Exceptional 15.6% |
| Yaqui | 98.1 /100 | #97 | Exceptional 15.6% |
| Zimbabweans | 98.1 /100 | #98 | Exceptional 15.6% |
| Immigrants | Middle Africa | 97.4 /100 | #99 | Exceptional 15.6% |
| Immigrants | Chile | 96.9 /100 | #100 | Exceptional 15.7% |
| Fijians | 96.8 /100 | #101 | Exceptional 15.7% |
| Chileans | 96.4 /100 | #102 | Exceptional 15.7% |
| South American Indians | 96.2 /100 | #103 | Exceptional 15.7% |
| Australians | 96.1 /100 | #104 | Exceptional 15.7% |
| Immigrants | Australia | 96.1 /100 | #105 | Exceptional 15.7% |
| Immigrants | Poland | 95.8 /100 | #106 | Exceptional 15.7% |
| Native Hawaiians | 95.8 /100 | #107 | Exceptional 15.7% |
| Pakistanis | 95.7 /100 | #108 | Exceptional 15.7% |
| Turks | 95.1 /100 | #109 | Exceptional 15.8% |
Demographics Similar to Russians by Single Father Poverty
In terms of single father poverty, the demographic groups most similar to Russians are Ukrainian (16.4%, a difference of 0.020%), Immigrants from Venezuela (16.4%, a difference of 0.050%), Latvian (16.5%, a difference of 0.060%), Immigrants from Burma/Myanmar (16.5%, a difference of 0.11%), and Immigrants from Guyana (16.5%, a difference of 0.16%).
| Demographics | Rating | Rank | Single Father Poverty |
| Immigrants | Western Africa | 36.0 /100 | #181 | Fair 16.4% |
| Immigrants | Italy | 35.7 /100 | #182 | Fair 16.4% |
| Aleuts | 35.3 /100 | #183 | Fair 16.4% |
| Cambodians | 34.6 /100 | #184 | Fair 16.4% |
| Panamanians | 33.6 /100 | #185 | Fair 16.4% |
| Immigrants | Venezuela | 31.0 /100 | #186 | Fair 16.4% |
| Ukrainians | 30.4 /100 | #187 | Fair 16.4% |
| Russians | 30.1 /100 | #188 | Fair 16.4% |
| Latvians | 28.9 /100 | #189 | Fair 16.5% |
| Immigrants | Burma/Myanmar | 28.0 /100 | #190 | Fair 16.5% |
| Immigrants | Guyana | 27.1 /100 | #191 | Fair 16.5% |
| Immigrants | Switzerland | 24.8 /100 | #192 | Fair 16.5% |
| Ecuadorians | 24.5 /100 | #193 | Fair 16.5% |
| Cape Verdeans | 24.4 /100 | #194 | Fair 16.5% |
| Immigrants | Barbados | 24.3 /100 | #195 | Fair 16.5% |