Icelander vs Immigrants from Austria Female Poverty
COMPARE
Icelander
Immigrants from Austria
Female Poverty
Female Poverty Comparison
Icelanders
Immigrants from Austria
13.0%
FEMALE POVERTY
81.1/ 100
METRIC RATING
141st/ 347
METRIC RANK
12.0%
FEMALE POVERTY
98.7/ 100
METRIC RATING
53rd/ 347
METRIC RANK
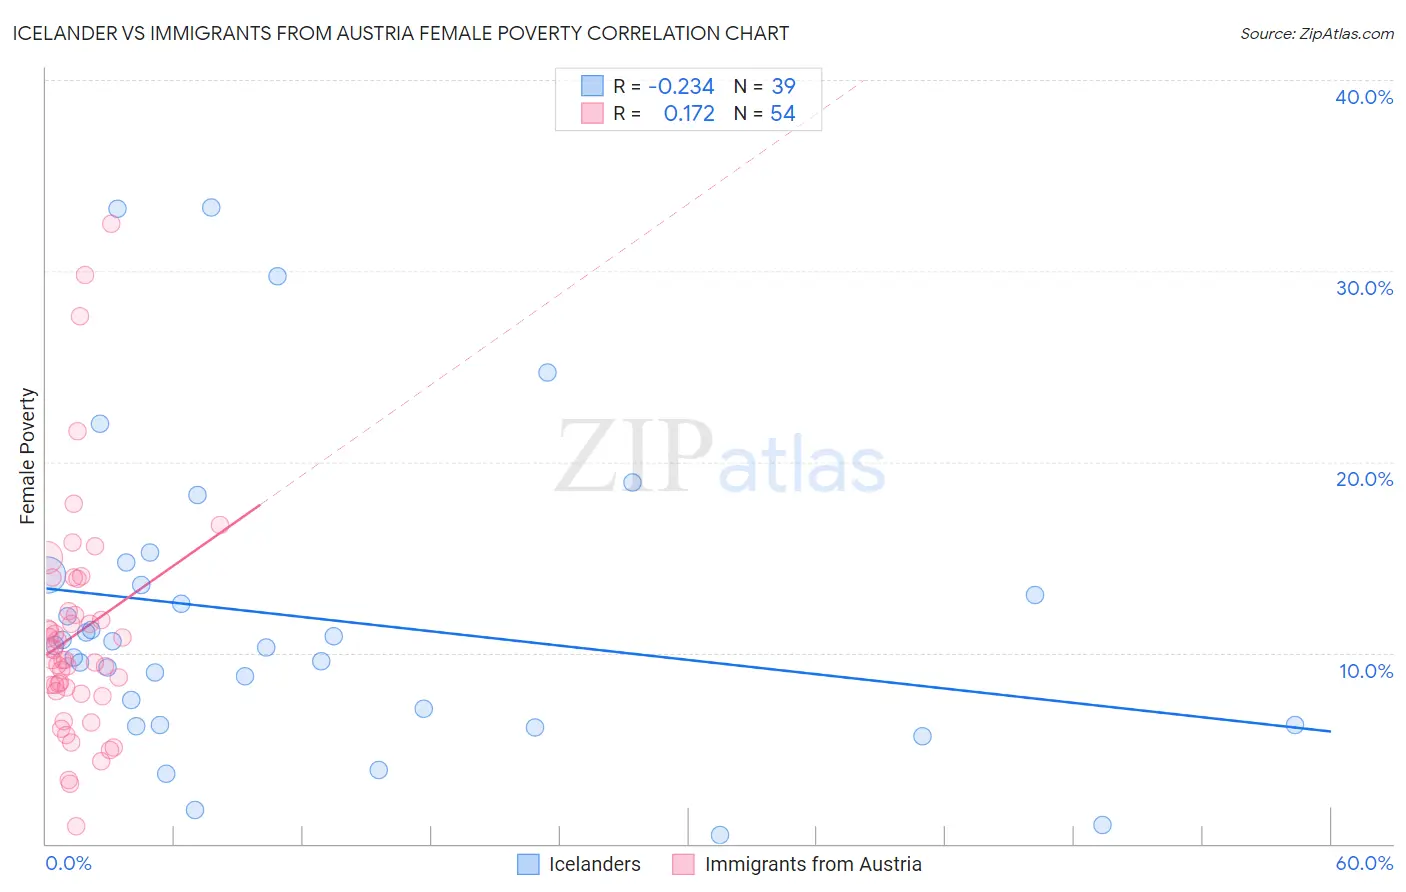
Icelander vs Immigrants from Austria Female Poverty Correlation Chart
The statistical analysis conducted on geographies consisting of 159,608,280 people shows a weak negative correlation between the proportion of Icelanders and poverty level among females in the United States with a correlation coefficient (R) of -0.234 and weighted average of 13.0%. Similarly, the statistical analysis conducted on geographies consisting of 167,923,164 people shows a poor positive correlation between the proportion of Immigrants from Austria and poverty level among females in the United States with a correlation coefficient (R) of 0.172 and weighted average of 12.0%, a difference of 7.8%.
Female Poverty Correlation Summary
| Measurement | Icelander | Immigrants from Austria |
| Minimum | 0.47% | 0.92% |
| Maximum | 33.3% | 32.5% |
| Range | 32.9% | 31.6% |
| Mean | 11.8% | 11.0% |
| Median | 10.4% | 9.6% |
| Interquartile 25% (IQ1) | 6.2% | 8.0% |
| Interquartile 75% (IQ3) | 14.1% | 12.2% |
| Interquartile Range (IQR) | 7.8% | 4.2% |
| Standard Deviation (Sample) | 7.9% | 6.0% |
| Standard Deviation (Population) | 7.8% | 6.0% |
Similar Demographics by Female Poverty
Demographics Similar to Icelanders by Female Poverty
In terms of female poverty, the demographic groups most similar to Icelanders are Brazilian (13.0%, a difference of 0.10%), Immigrants from Malaysia (13.0%, a difference of 0.12%), Afghan (13.0%, a difference of 0.21%), Syrian (13.0%, a difference of 0.24%), and Immigrants from Peru (13.0%, a difference of 0.31%).
| Demographics | Rating | Rank | Female Poverty |
| Immigrants | Switzerland | 85.8 /100 | #134 | Excellent 12.9% |
| French | 85.6 /100 | #135 | Excellent 12.9% |
| Peruvians | 85.2 /100 | #136 | Excellent 12.9% |
| Chileans | 84.7 /100 | #137 | Excellent 12.9% |
| Immigrants | France | 83.6 /100 | #138 | Excellent 12.9% |
| Basques | 83.1 /100 | #139 | Excellent 12.9% |
| Pakistanis | 83.0 /100 | #140 | Excellent 12.9% |
| Icelanders | 81.1 /100 | #141 | Excellent 13.0% |
| Brazilians | 80.5 /100 | #142 | Excellent 13.0% |
| Immigrants | Malaysia | 80.4 /100 | #143 | Excellent 13.0% |
| Afghans | 79.8 /100 | #144 | Good 13.0% |
| Syrians | 79.6 /100 | #145 | Good 13.0% |
| Immigrants | Peru | 79.1 /100 | #146 | Good 13.0% |
| Immigrants | Kazakhstan | 78.6 /100 | #147 | Good 13.0% |
| Yugoslavians | 76.9 /100 | #148 | Good 13.1% |
Demographics Similar to Immigrants from Austria by Female Poverty
In terms of female poverty, the demographic groups most similar to Immigrants from Austria are Immigrants from Croatia (12.0%, a difference of 0.010%), Immigrants from Philippines (12.1%, a difference of 0.14%), Immigrants from Bulgaria (12.0%, a difference of 0.31%), Immigrants from Sri Lanka (12.1%, a difference of 0.50%), and Slovene (12.0%, a difference of 0.53%).
| Demographics | Rating | Rank | Female Poverty |
| Turks | 99.2 /100 | #46 | Exceptional 11.9% |
| Asians | 99.1 /100 | #47 | Exceptional 11.9% |
| Immigrants | Japan | 99.0 /100 | #48 | Exceptional 11.9% |
| Immigrants | Romania | 99.0 /100 | #49 | Exceptional 12.0% |
| Slovenes | 98.9 /100 | #50 | Exceptional 12.0% |
| Immigrants | Bulgaria | 98.9 /100 | #51 | Exceptional 12.0% |
| Immigrants | Croatia | 98.7 /100 | #52 | Exceptional 12.0% |
| Immigrants | Austria | 98.7 /100 | #53 | Exceptional 12.0% |
| Immigrants | Philippines | 98.7 /100 | #54 | Exceptional 12.1% |
| Immigrants | Sri Lanka | 98.5 /100 | #55 | Exceptional 12.1% |
| Estonians | 98.3 /100 | #56 | Exceptional 12.1% |
| Immigrants | Serbia | 98.3 /100 | #57 | Exceptional 12.1% |
| Scandinavians | 98.2 /100 | #58 | Exceptional 12.1% |
| Immigrants | Europe | 98.2 /100 | #59 | Exceptional 12.1% |
| Immigrants | Australia | 98.1 /100 | #60 | Exceptional 12.2% |