Hungarian vs Comanche Single Father Poverty
COMPARE
Hungarian
Comanche
Single Father Poverty
Single Father Poverty Comparison
Hungarians
Comanche
18.5%
SINGLE FATHER POVERTY
0.0/ 100
METRIC RATING
301st/ 347
METRIC RANK
18.5%
SINGLE FATHER POVERTY
0.0/ 100
METRIC RATING
302nd/ 347
METRIC RANK
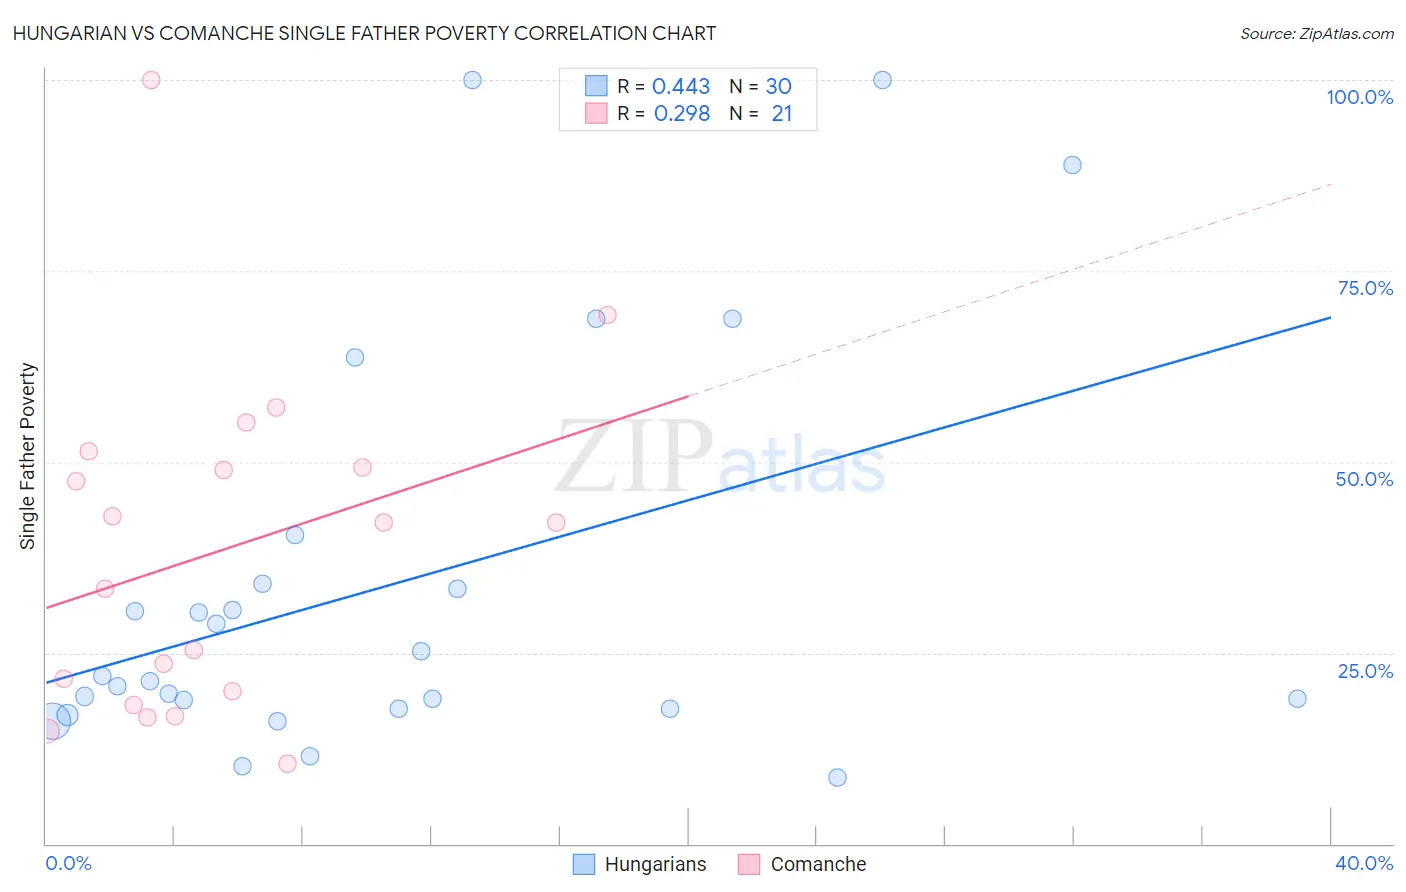
Hungarian vs Comanche Single Father Poverty Correlation Chart
The statistical analysis conducted on geographies consisting of 362,286,644 people shows a moderate positive correlation between the proportion of Hungarians and poverty level among single fathers in the United States with a correlation coefficient (R) of 0.443 and weighted average of 18.5%. Similarly, the statistical analysis conducted on geographies consisting of 100,339,334 people shows a weak positive correlation between the proportion of Comanche and poverty level among single fathers in the United States with a correlation coefficient (R) of 0.298 and weighted average of 18.5%, a difference of 0.11%.
Single Father Poverty Correlation Summary
| Measurement | Hungarian | Comanche |
| Minimum | 8.6% | 10.5% |
| Maximum | 100.0% | 100.0% |
| Range | 91.4% | 89.5% |
| Mean | 33.9% | 38.4% |
| Median | 21.6% | 42.1% |
| Interquartile 25% (IQ1) | 17.7% | 19.1% |
| Interquartile 75% (IQ3) | 34.0% | 50.3% |
| Interquartile Range (IQR) | 16.3% | 31.2% |
| Standard Deviation (Sample) | 26.2% | 21.9% |
| Standard Deviation (Population) | 25.8% | 21.4% |
Demographics Similar to Hungarians and Comanche by Single Father Poverty
In terms of single father poverty, the demographic groups most similar to Hungarians are Celtic (18.5%, a difference of 0.15%), Immigrants from Dominican Republic (18.4%, a difference of 0.22%), Ute (18.5%, a difference of 0.29%), Blackfeet (18.5%, a difference of 0.34%), and White/Caucasian (18.4%, a difference of 0.53%). Similarly, the demographic groups most similar to Comanche are Celtic (18.5%, a difference of 0.040%), Ute (18.5%, a difference of 0.18%), Blackfeet (18.5%, a difference of 0.23%), Immigrants from Dominican Republic (18.4%, a difference of 0.32%), and Scotch-Irish (18.6%, a difference of 0.45%).
| Demographics | Rating | Rank | Single Father Poverty |
| Alaskan Athabascans | 0.0 /100 | #291 | Tragic 18.1% |
| Immigrants | Bahamas | 0.0 /100 | #292 | Tragic 18.1% |
| Alaska Natives | 0.0 /100 | #293 | Tragic 18.1% |
| U.S. Virgin Islanders | 0.0 /100 | #294 | Tragic 18.1% |
| Yakama | 0.0 /100 | #295 | Tragic 18.1% |
| Seminole | 0.0 /100 | #296 | Tragic 18.1% |
| French | 0.0 /100 | #297 | Tragic 18.2% |
| Africans | 0.0 /100 | #298 | Tragic 18.3% |
| Whites/Caucasians | 0.0 /100 | #299 | Tragic 18.4% |
| Immigrants | Dominican Republic | 0.0 /100 | #300 | Tragic 18.4% |
| Hungarians | 0.0 /100 | #301 | Tragic 18.5% |
| Comanche | 0.0 /100 | #302 | Tragic 18.5% |
| Celtics | 0.0 /100 | #303 | Tragic 18.5% |
| Ute | 0.0 /100 | #304 | Tragic 18.5% |
| Blackfeet | 0.0 /100 | #305 | Tragic 18.5% |
| Scotch-Irish | 0.0 /100 | #306 | Tragic 18.6% |
| French Canadians | 0.0 /100 | #307 | Tragic 18.6% |
| Ottawa | 0.0 /100 | #308 | Tragic 18.6% |
| Immigrants | Micronesia | 0.0 /100 | #309 | Tragic 18.6% |
| Chippewa | 0.0 /100 | #310 | Tragic 18.8% |
| Immigrants | Nonimmigrants | 0.0 /100 | #311 | Tragic 18.8% |