Hungarian vs Immigrants from Australia Single Female Poverty
COMPARE
Hungarian
Immigrants from Australia
Single Female Poverty
Single Female Poverty Comparison
Hungarians
Immigrants from Australia
21.1%
SINGLE FEMALE POVERTY
39.6/ 100
METRIC RATING
184th/ 347
METRIC RANK
19.4%
SINGLE FEMALE POVERTY
99.3/ 100
METRIC RATING
80th/ 347
METRIC RANK
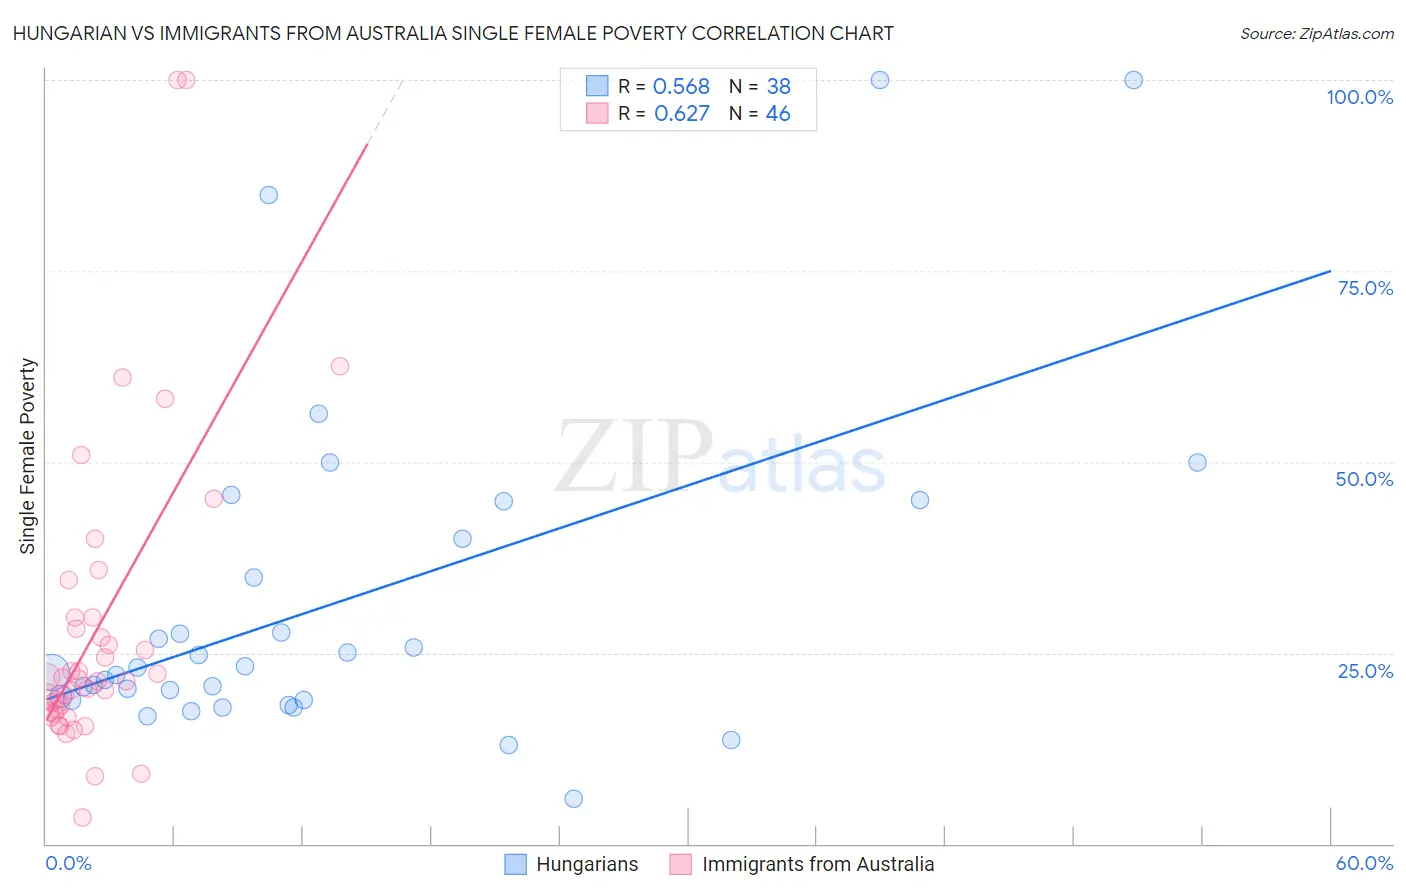
Hungarian vs Immigrants from Australia Single Female Poverty Correlation Chart
The statistical analysis conducted on geographies consisting of 473,502,236 people shows a substantial positive correlation between the proportion of Hungarians and poverty level among single females in the United States with a correlation coefficient (R) of 0.568 and weighted average of 21.1%. Similarly, the statistical analysis conducted on geographies consisting of 224,453,715 people shows a significant positive correlation between the proportion of Immigrants from Australia and poverty level among single females in the United States with a correlation coefficient (R) of 0.627 and weighted average of 19.4%, a difference of 8.9%.
Single Female Poverty Correlation Summary
| Measurement | Hungarian | Immigrants from Australia |
| Minimum | 6.0% | 3.5% |
| Maximum | 100.0% | 100.0% |
| Range | 94.0% | 96.5% |
| Mean | 31.6% | 28.1% |
| Median | 22.7% | 21.4% |
| Interquartile 25% (IQ1) | 18.9% | 17.3% |
| Interquartile 75% (IQ3) | 40.0% | 29.7% |
| Interquartile Range (IQR) | 21.1% | 12.3% |
| Standard Deviation (Sample) | 22.1% | 20.2% |
| Standard Deviation (Population) | 21.8% | 20.0% |
Similar Demographics by Single Female Poverty
Demographics Similar to Hungarians by Single Female Poverty
In terms of single female poverty, the demographic groups most similar to Hungarians are Slovak (21.1%, a difference of 0.010%), Slavic (21.1%, a difference of 0.060%), Immigrants from Cambodia (21.2%, a difference of 0.090%), Hawaiian (21.2%, a difference of 0.13%), and Spanish American Indian (21.1%, a difference of 0.18%).
| Demographics | Rating | Rank | Single Female Poverty |
| Scandinavians | 45.2 /100 | #177 | Average 21.1% |
| Immigrants | Bosnia and Herzegovina | 44.9 /100 | #178 | Average 21.1% |
| British | 42.9 /100 | #179 | Average 21.1% |
| Spanish American Indians | 42.5 /100 | #180 | Average 21.1% |
| Europeans | 42.3 /100 | #181 | Average 21.1% |
| Slavs | 40.5 /100 | #182 | Average 21.1% |
| Slovaks | 39.7 /100 | #183 | Fair 21.1% |
| Hungarians | 39.6 /100 | #184 | Fair 21.1% |
| Immigrants | Cambodia | 38.2 /100 | #185 | Fair 21.2% |
| Hawaiians | 37.7 /100 | #186 | Fair 21.2% |
| Immigrants | Nigeria | 36.8 /100 | #187 | Fair 21.2% |
| Yugoslavians | 35.4 /100 | #188 | Fair 21.2% |
| Immigrants | Cuba | 35.3 /100 | #189 | Fair 21.2% |
| Trinidadians and Tobagonians | 35.2 /100 | #190 | Fair 21.2% |
| Immigrants | Germany | 31.1 /100 | #191 | Fair 21.3% |
Demographics Similar to Immigrants from Australia by Single Female Poverty
In terms of single female poverty, the demographic groups most similar to Immigrants from Australia are Immigrants from Scotland (19.4%, a difference of 0.020%), Immigrants from Malaysia (19.4%, a difference of 0.030%), Immigrants from Sierra Leone (19.4%, a difference of 0.040%), Taiwanese (19.4%, a difference of 0.050%), and Albanian (19.4%, a difference of 0.060%).
| Demographics | Rating | Rank | Single Female Poverty |
| Immigrants | Peru | 99.4 /100 | #73 | Exceptional 19.3% |
| Immigrants | Belarus | 99.4 /100 | #74 | Exceptional 19.3% |
| Immigrants | Turkey | 99.4 /100 | #75 | Exceptional 19.4% |
| Peruvians | 99.4 /100 | #76 | Exceptional 19.4% |
| Immigrants | Russia | 99.3 /100 | #77 | Exceptional 19.4% |
| Albanians | 99.3 /100 | #78 | Exceptional 19.4% |
| Immigrants | Sierra Leone | 99.3 /100 | #79 | Exceptional 19.4% |
| Immigrants | Australia | 99.3 /100 | #80 | Exceptional 19.4% |
| Immigrants | Scotland | 99.2 /100 | #81 | Exceptional 19.4% |
| Immigrants | Malaysia | 99.2 /100 | #82 | Exceptional 19.4% |
| Taiwanese | 99.2 /100 | #83 | Exceptional 19.4% |
| Immigrants | Sweden | 99.2 /100 | #84 | Exceptional 19.4% |
| Immigrants | Albania | 99.2 /100 | #85 | Exceptional 19.4% |
| Greeks | 99.2 /100 | #86 | Exceptional 19.4% |
| Zimbabweans | 99.0 /100 | #87 | Exceptional 19.5% |