Honduran vs Liberian Single Father Poverty
COMPARE
Honduran
Liberian
Single Father Poverty
Single Father Poverty Comparison
Hondurans
Liberians
17.0%
SINGLE FATHER POVERTY
1.6/ 100
METRIC RATING
244th/ 347
METRIC RANK
16.0%
SINGLE FATHER POVERTY
83.3/ 100
METRIC RATING
141st/ 347
METRIC RANK
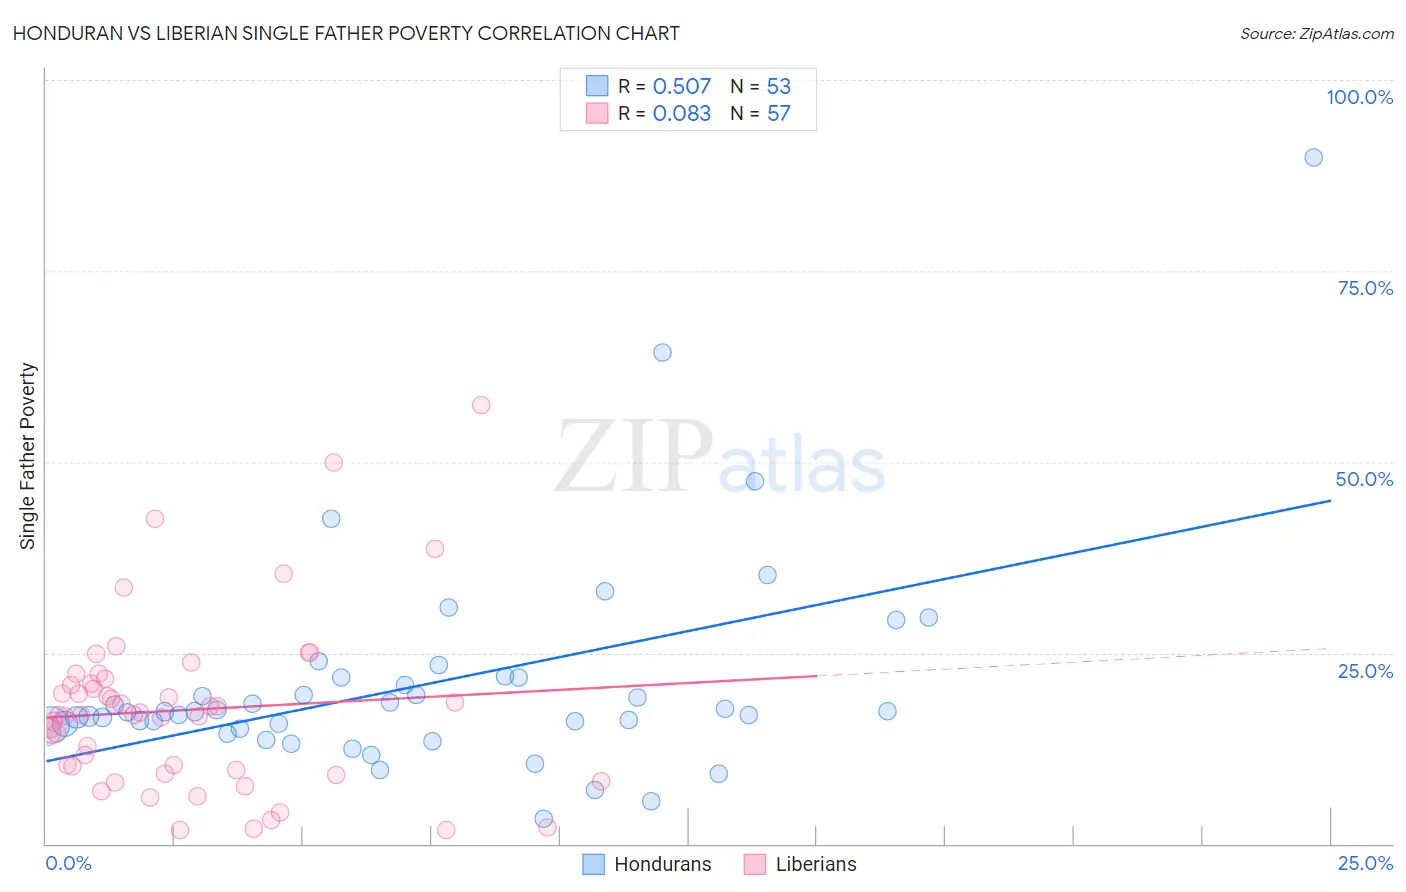
Honduran vs Liberian Single Father Poverty Correlation Chart
The statistical analysis conducted on geographies consisting of 295,716,434 people shows a substantial positive correlation between the proportion of Hondurans and poverty level among single fathers in the United States with a correlation coefficient (R) of 0.507 and weighted average of 17.0%. Similarly, the statistical analysis conducted on geographies consisting of 107,628,727 people shows a slight positive correlation between the proportion of Liberians and poverty level among single fathers in the United States with a correlation coefficient (R) of 0.083 and weighted average of 16.0%, a difference of 6.5%.
Single Father Poverty Correlation Summary
| Measurement | Honduran | Liberian |
| Minimum | 3.3% | 1.7% |
| Maximum | 89.9% | 57.4% |
| Range | 86.6% | 55.7% |
| Mean | 20.9% | 17.5% |
| Median | 17.3% | 16.9% |
| Interquartile 25% (IQ1) | 15.3% | 9.4% |
| Interquartile 75% (IQ3) | 21.8% | 21.3% |
| Interquartile Range (IQR) | 6.5% | 11.9% |
| Standard Deviation (Sample) | 14.1% | 11.3% |
| Standard Deviation (Population) | 14.0% | 11.2% |
Similar Demographics by Single Father Poverty
Demographics Similar to Hondurans by Single Father Poverty
In terms of single father poverty, the demographic groups most similar to Hondurans are Immigrants from Cabo Verde (17.0%, a difference of 0.020%), Trinidadian and Tobagonian (17.0%, a difference of 0.040%), Immigrants from Ireland (17.1%, a difference of 0.080%), Greek (17.1%, a difference of 0.18%), and Czechoslovakian (17.1%, a difference of 0.18%).
| Demographics | Rating | Rank | Single Father Poverty |
| Sub-Saharan Africans | 2.9 /100 | #237 | Tragic 16.9% |
| Immigrants | Saudi Arabia | 2.7 /100 | #238 | Tragic 16.9% |
| Bermudans | 2.6 /100 | #239 | Tragic 16.9% |
| Finns | 2.6 /100 | #240 | Tragic 16.9% |
| Czechs | 2.3 /100 | #241 | Tragic 17.0% |
| Moroccans | 2.1 /100 | #242 | Tragic 17.0% |
| Immigrants | Cabo Verde | 1.6 /100 | #243 | Tragic 17.0% |
| Hondurans | 1.6 /100 | #244 | Tragic 17.0% |
| Trinidadians and Tobagonians | 1.5 /100 | #245 | Tragic 17.0% |
| Immigrants | Ireland | 1.4 /100 | #246 | Tragic 17.1% |
| Greeks | 1.3 /100 | #247 | Tragic 17.1% |
| Czechoslovakians | 1.3 /100 | #248 | Tragic 17.1% |
| Canadians | 1.3 /100 | #249 | Tragic 17.1% |
| Austrians | 1.1 /100 | #250 | Tragic 17.1% |
| Luxembourgers | 1.1 /100 | #251 | Tragic 17.1% |
Demographics Similar to Liberians by Single Father Poverty
In terms of single father poverty, the demographic groups most similar to Liberians are Immigrants from Mexico (16.0%, a difference of 0.0%), Immigrants from Central America (16.0%, a difference of 0.020%), Immigrants from Kuwait (16.0%, a difference of 0.15%), Immigrants from Netherlands (16.0%, a difference of 0.17%), and Immigrants from Western Asia (16.0%, a difference of 0.20%).
| Demographics | Rating | Rank | Single Father Poverty |
| Immigrants | South America | 88.5 /100 | #134 | Excellent 15.9% |
| Immigrants | Sri Lanka | 88.2 /100 | #135 | Excellent 15.9% |
| Cypriots | 87.5 /100 | #136 | Excellent 15.9% |
| Immigrants | Azores | 87.2 /100 | #137 | Excellent 15.9% |
| Central Americans | 87.1 /100 | #138 | Excellent 16.0% |
| South Americans | 85.9 /100 | #139 | Excellent 16.0% |
| Immigrants | Netherlands | 85.3 /100 | #140 | Excellent 16.0% |
| Liberians | 83.3 /100 | #141 | Excellent 16.0% |
| Immigrants | Mexico | 83.3 /100 | #142 | Excellent 16.0% |
| Immigrants | Central America | 83.1 /100 | #143 | Excellent 16.0% |
| Immigrants | Kuwait | 81.4 /100 | #144 | Excellent 16.0% |
| Immigrants | Western Asia | 80.7 /100 | #145 | Excellent 16.0% |
| Immigrants | Hungary | 78.3 /100 | #146 | Good 16.1% |
| Colombians | 77.1 /100 | #147 | Good 16.1% |
| Nigerians | 76.8 /100 | #148 | Good 16.1% |