Honduran vs Immigrants from Fiji Single Father Poverty
COMPARE
Honduran
Immigrants from Fiji
Single Father Poverty
Single Father Poverty Comparison
Hondurans
Immigrants from Fiji
17.0%
SINGLE FATHER POVERTY
1.6/ 100
METRIC RATING
244th/ 347
METRIC RANK
13.2%
SINGLE FATHER POVERTY
100.0/ 100
METRIC RATING
4th/ 347
METRIC RANK
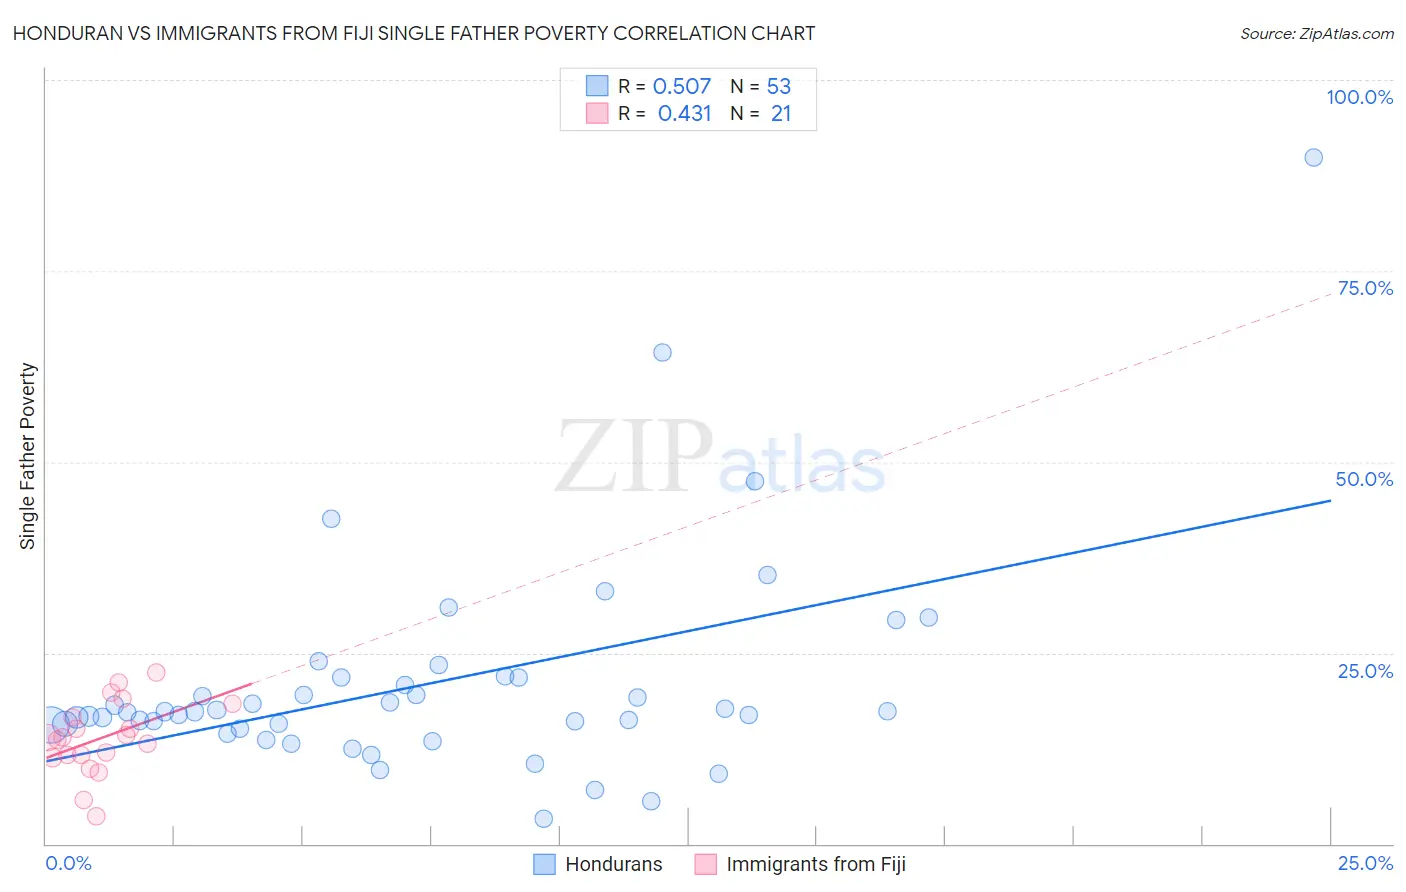
Honduran vs Immigrants from Fiji Single Father Poverty Correlation Chart
The statistical analysis conducted on geographies consisting of 295,716,434 people shows a substantial positive correlation between the proportion of Hondurans and poverty level among single fathers in the United States with a correlation coefficient (R) of 0.507 and weighted average of 17.0%. Similarly, the statistical analysis conducted on geographies consisting of 85,969,889 people shows a moderate positive correlation between the proportion of Immigrants from Fiji and poverty level among single fathers in the United States with a correlation coefficient (R) of 0.431 and weighted average of 13.2%, a difference of 28.8%.
Single Father Poverty Correlation Summary
| Measurement | Honduran | Immigrants from Fiji |
| Minimum | 3.3% | 3.7% |
| Maximum | 89.9% | 22.5% |
| Range | 86.6% | 18.8% |
| Mean | 20.9% | 13.9% |
| Median | 17.3% | 13.9% |
| Interquartile 25% (IQ1) | 15.3% | 11.4% |
| Interquartile 75% (IQ3) | 21.8% | 17.4% |
| Interquartile Range (IQR) | 6.5% | 6.0% |
| Standard Deviation (Sample) | 14.1% | 4.7% |
| Standard Deviation (Population) | 14.0% | 4.6% |
Similar Demographics by Single Father Poverty
Demographics Similar to Hondurans by Single Father Poverty
In terms of single father poverty, the demographic groups most similar to Hondurans are Immigrants from Cabo Verde (17.0%, a difference of 0.020%), Trinidadian and Tobagonian (17.0%, a difference of 0.040%), Immigrants from Ireland (17.1%, a difference of 0.080%), Greek (17.1%, a difference of 0.18%), and Czechoslovakian (17.1%, a difference of 0.18%).
| Demographics | Rating | Rank | Single Father Poverty |
| Sub-Saharan Africans | 2.9 /100 | #237 | Tragic 16.9% |
| Immigrants | Saudi Arabia | 2.7 /100 | #238 | Tragic 16.9% |
| Bermudans | 2.6 /100 | #239 | Tragic 16.9% |
| Finns | 2.6 /100 | #240 | Tragic 16.9% |
| Czechs | 2.3 /100 | #241 | Tragic 17.0% |
| Moroccans | 2.1 /100 | #242 | Tragic 17.0% |
| Immigrants | Cabo Verde | 1.6 /100 | #243 | Tragic 17.0% |
| Hondurans | 1.6 /100 | #244 | Tragic 17.0% |
| Trinidadians and Tobagonians | 1.5 /100 | #245 | Tragic 17.0% |
| Immigrants | Ireland | 1.4 /100 | #246 | Tragic 17.1% |
| Greeks | 1.3 /100 | #247 | Tragic 17.1% |
| Czechoslovakians | 1.3 /100 | #248 | Tragic 17.1% |
| Canadians | 1.3 /100 | #249 | Tragic 17.1% |
| Austrians | 1.1 /100 | #250 | Tragic 17.1% |
| Luxembourgers | 1.1 /100 | #251 | Tragic 17.1% |
Demographics Similar to Immigrants from Fiji by Single Father Poverty
In terms of single father poverty, the demographic groups most similar to Immigrants from Fiji are Immigrants from Ethiopia (13.4%, a difference of 1.6%), Ethiopian (13.5%, a difference of 2.3%), Immigrants from Taiwan (13.7%, a difference of 3.4%), Tsimshian (12.7%, a difference of 4.2%), and Samoan (13.8%, a difference of 4.3%).
| Demographics | Rating | Rank | Single Father Poverty |
| Assyrians/Chaldeans/Syriacs | 100.0 /100 | #1 | Exceptional 11.7% |
| Tongans | 100.0 /100 | #2 | Exceptional 12.2% |
| Tsimshian | 100.0 /100 | #3 | Exceptional 12.7% |
| Immigrants | Fiji | 100.0 /100 | #4 | Exceptional 13.2% |
| Immigrants | Ethiopia | 100.0 /100 | #5 | Exceptional 13.4% |
| Ethiopians | 100.0 /100 | #6 | Exceptional 13.5% |
| Immigrants | Taiwan | 100.0 /100 | #7 | Exceptional 13.7% |
| Samoans | 100.0 /100 | #8 | Exceptional 13.8% |
| Afghans | 100.0 /100 | #9 | Exceptional 14.0% |
| Koreans | 100.0 /100 | #10 | Exceptional 14.0% |
| Filipinos | 100.0 /100 | #11 | Exceptional 14.0% |
| Immigrants | India | 100.0 /100 | #12 | Exceptional 14.0% |
| Immigrants | Philippines | 100.0 /100 | #13 | Exceptional 14.0% |
| Immigrants | Vietnam | 100.0 /100 | #14 | Exceptional 14.1% |
| Sri Lankans | 100.0 /100 | #15 | Exceptional 14.2% |