Czech vs Liberian Single Father Poverty
COMPARE
Czech
Liberian
Single Father Poverty
Single Father Poverty Comparison
Czechs
Liberians
17.0%
SINGLE FATHER POVERTY
2.3/ 100
METRIC RATING
241st/ 347
METRIC RANK
16.0%
SINGLE FATHER POVERTY
83.3/ 100
METRIC RATING
141st/ 347
METRIC RANK
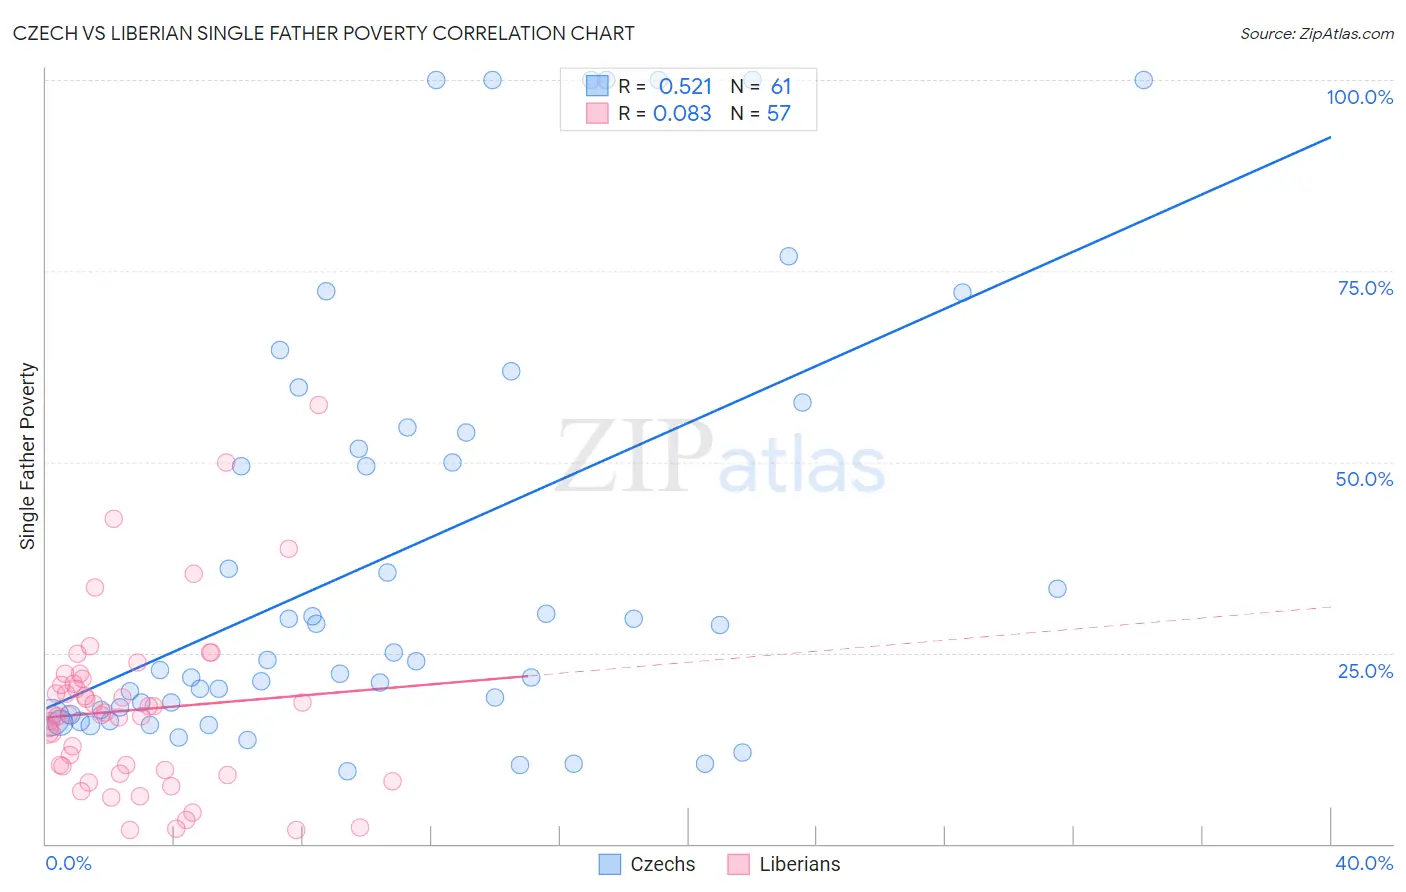
Czech vs Liberian Single Father Poverty Correlation Chart
The statistical analysis conducted on geographies consisting of 358,801,462 people shows a substantial positive correlation between the proportion of Czechs and poverty level among single fathers in the United States with a correlation coefficient (R) of 0.521 and weighted average of 17.0%. Similarly, the statistical analysis conducted on geographies consisting of 107,628,727 people shows a slight positive correlation between the proportion of Liberians and poverty level among single fathers in the United States with a correlation coefficient (R) of 0.083 and weighted average of 16.0%, a difference of 6.0%.
Single Father Poverty Correlation Summary
| Measurement | Czech | Liberian |
| Minimum | 9.5% | 1.7% |
| Maximum | 100.0% | 57.4% |
| Range | 90.5% | 55.7% |
| Mean | 38.0% | 17.5% |
| Median | 24.1% | 16.9% |
| Interquartile 25% (IQ1) | 17.3% | 9.4% |
| Interquartile 75% (IQ3) | 54.2% | 21.3% |
| Interquartile Range (IQR) | 36.9% | 11.9% |
| Standard Deviation (Sample) | 28.4% | 11.3% |
| Standard Deviation (Population) | 28.2% | 11.2% |
Similar Demographics by Single Father Poverty
Demographics Similar to Czechs by Single Father Poverty
In terms of single father poverty, the demographic groups most similar to Czechs are Moroccan (17.0%, a difference of 0.10%), Finnish (16.9%, a difference of 0.12%), Bermudan (16.9%, a difference of 0.13%), Immigrants from Saudi Arabia (16.9%, a difference of 0.15%), and Subsaharan African (16.9%, a difference of 0.22%).
| Demographics | Rating | Rank | Single Father Poverty |
| Marshallese | 3.1 /100 | #234 | Tragic 16.9% |
| Immigrants | Western Europe | 2.9 /100 | #235 | Tragic 16.9% |
| Immigrants | Germany | 2.9 /100 | #236 | Tragic 16.9% |
| Sub-Saharan Africans | 2.9 /100 | #237 | Tragic 16.9% |
| Immigrants | Saudi Arabia | 2.7 /100 | #238 | Tragic 16.9% |
| Bermudans | 2.6 /100 | #239 | Tragic 16.9% |
| Finns | 2.6 /100 | #240 | Tragic 16.9% |
| Czechs | 2.3 /100 | #241 | Tragic 17.0% |
| Moroccans | 2.1 /100 | #242 | Tragic 17.0% |
| Immigrants | Cabo Verde | 1.6 /100 | #243 | Tragic 17.0% |
| Hondurans | 1.6 /100 | #244 | Tragic 17.0% |
| Trinidadians and Tobagonians | 1.5 /100 | #245 | Tragic 17.0% |
| Immigrants | Ireland | 1.4 /100 | #246 | Tragic 17.1% |
| Greeks | 1.3 /100 | #247 | Tragic 17.1% |
| Czechoslovakians | 1.3 /100 | #248 | Tragic 17.1% |
Demographics Similar to Liberians by Single Father Poverty
In terms of single father poverty, the demographic groups most similar to Liberians are Immigrants from Mexico (16.0%, a difference of 0.0%), Immigrants from Central America (16.0%, a difference of 0.020%), Immigrants from Kuwait (16.0%, a difference of 0.15%), Immigrants from Netherlands (16.0%, a difference of 0.17%), and Immigrants from Western Asia (16.0%, a difference of 0.20%).
| Demographics | Rating | Rank | Single Father Poverty |
| Immigrants | South America | 88.5 /100 | #134 | Excellent 15.9% |
| Immigrants | Sri Lanka | 88.2 /100 | #135 | Excellent 15.9% |
| Cypriots | 87.5 /100 | #136 | Excellent 15.9% |
| Immigrants | Azores | 87.2 /100 | #137 | Excellent 15.9% |
| Central Americans | 87.1 /100 | #138 | Excellent 16.0% |
| South Americans | 85.9 /100 | #139 | Excellent 16.0% |
| Immigrants | Netherlands | 85.3 /100 | #140 | Excellent 16.0% |
| Liberians | 83.3 /100 | #141 | Excellent 16.0% |
| Immigrants | Mexico | 83.3 /100 | #142 | Excellent 16.0% |
| Immigrants | Central America | 83.1 /100 | #143 | Excellent 16.0% |
| Immigrants | Kuwait | 81.4 /100 | #144 | Excellent 16.0% |
| Immigrants | Western Asia | 80.7 /100 | #145 | Excellent 16.0% |
| Immigrants | Hungary | 78.3 /100 | #146 | Good 16.1% |
| Colombians | 77.1 /100 | #147 | Good 16.1% |
| Nigerians | 76.8 /100 | #148 | Good 16.1% |