Hmong vs Australian Single Female Poverty
COMPARE
Hmong
Australian
Single Female Poverty
Single Female Poverty Comparison
Hmong
Australians
23.1%
SINGLE FEMALE POVERTY
0.2/ 100
METRIC RATING
269th/ 347
METRIC RANK
20.3%
SINGLE FEMALE POVERTY
88.4/ 100
METRIC RATING
143rd/ 347
METRIC RANK
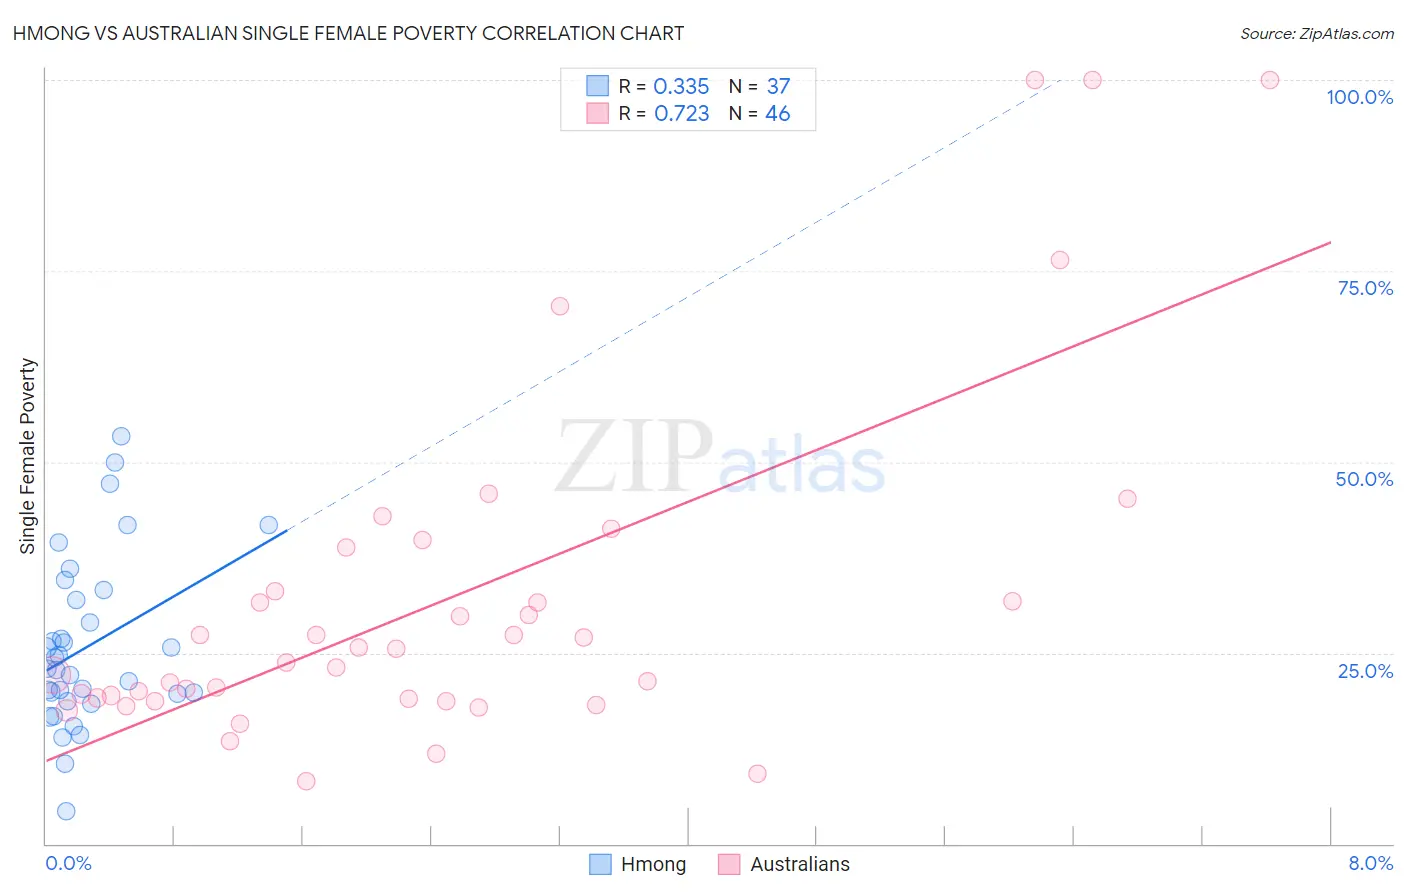
Hmong vs Australian Single Female Poverty Correlation Chart
The statistical analysis conducted on geographies consisting of 24,642,418 people shows a mild positive correlation between the proportion of Hmong and poverty level among single females in the United States with a correlation coefficient (R) of 0.335 and weighted average of 23.1%. Similarly, the statistical analysis conducted on geographies consisting of 221,875,753 people shows a strong positive correlation between the proportion of Australians and poverty level among single females in the United States with a correlation coefficient (R) of 0.723 and weighted average of 20.3%, a difference of 13.4%.
Single Female Poverty Correlation Summary
| Measurement | Hmong | Australian |
| Minimum | 4.3% | 8.1% |
| Maximum | 53.4% | 100.0% |
| Range | 49.1% | 91.9% |
| Mean | 25.8% | 31.8% |
| Median | 22.9% | 24.7% |
| Interquartile 25% (IQ1) | 19.1% | 19.0% |
| Interquartile 75% (IQ3) | 32.5% | 33.1% |
| Interquartile Range (IQR) | 13.4% | 14.1% |
| Standard Deviation (Sample) | 11.0% | 22.6% |
| Standard Deviation (Population) | 10.9% | 22.4% |
Similar Demographics by Single Female Poverty
Demographics Similar to Hmong by Single Female Poverty
In terms of single female poverty, the demographic groups most similar to Hmong are Fijian (23.1%, a difference of 0.030%), Senegalese (23.0%, a difference of 0.10%), Immigrants from Micronesia (23.0%, a difference of 0.16%), Inupiat (23.1%, a difference of 0.26%), and Central American (23.0%, a difference of 0.37%).
| Demographics | Rating | Rank | Single Female Poverty |
| British West Indians | 0.4 /100 | #262 | Tragic 22.8% |
| Scotch-Irish | 0.3 /100 | #263 | Tragic 22.9% |
| Immigrants | Laos | 0.3 /100 | #264 | Tragic 22.9% |
| Central Americans | 0.2 /100 | #265 | Tragic 23.0% |
| Immigrants | Micronesia | 0.2 /100 | #266 | Tragic 23.0% |
| Senegalese | 0.2 /100 | #267 | Tragic 23.0% |
| Fijians | 0.2 /100 | #268 | Tragic 23.1% |
| Hmong | 0.2 /100 | #269 | Tragic 23.1% |
| Inupiat | 0.2 /100 | #270 | Tragic 23.1% |
| Sub-Saharan Africans | 0.1 /100 | #271 | Tragic 23.2% |
| Immigrants | Senegal | 0.1 /100 | #272 | Tragic 23.2% |
| Alaska Natives | 0.1 /100 | #273 | Tragic 23.3% |
| Marshallese | 0.1 /100 | #274 | Tragic 23.3% |
| Mexican American Indians | 0.1 /100 | #275 | Tragic 23.4% |
| Immigrants | Azores | 0.0 /100 | #276 | Tragic 23.5% |
Demographics Similar to Australians by Single Female Poverty
In terms of single female poverty, the demographic groups most similar to Australians are Immigrants from Uzbekistan (20.3%, a difference of 0.010%), Immigrants from Uganda (20.3%, a difference of 0.12%), Immigrants from North America (20.3%, a difference of 0.19%), Syrian (20.3%, a difference of 0.34%), and Immigrants from Kuwait (20.3%, a difference of 0.35%).
| Demographics | Rating | Rank | Single Female Poverty |
| Immigrants | Canada | 91.2 /100 | #136 | Exceptional 20.2% |
| Immigrants | Nepal | 90.6 /100 | #137 | Exceptional 20.3% |
| Slovenes | 90.5 /100 | #138 | Exceptional 20.3% |
| Immigrants | Kuwait | 90.4 /100 | #139 | Exceptional 20.3% |
| Syrians | 90.4 /100 | #140 | Exceptional 20.3% |
| Immigrants | North America | 89.5 /100 | #141 | Excellent 20.3% |
| Immigrants | Uganda | 89.1 /100 | #142 | Excellent 20.3% |
| Australians | 88.4 /100 | #143 | Excellent 20.3% |
| Immigrants | Uzbekistan | 88.3 /100 | #144 | Excellent 20.3% |
| Austrians | 85.8 /100 | #145 | Excellent 20.4% |
| Venezuelans | 85.5 /100 | #146 | Excellent 20.4% |
| South Africans | 85.3 /100 | #147 | Excellent 20.4% |
| Luxembourgers | 84.9 /100 | #148 | Excellent 20.4% |
| Portuguese | 81.5 /100 | #149 | Excellent 20.5% |
| Immigrants | Denmark | 80.5 /100 | #150 | Excellent 20.5% |