Hawaiian vs Spanish Child Poverty Under the Age of 5
COMPARE
Hawaiian
Spanish
Child Poverty Under the Age of 5
Child Poverty Under the Age of 5 Comparison
Hawaiians
Spanish
17.4%
CHILD POVERTY UNDER THE AGE OF 5
41.5/ 100
METRIC RATING
179th/ 347
METRIC RANK
18.2%
CHILD POVERTY UNDER THE AGE OF 5
9.8/ 100
METRIC RATING
209th/ 347
METRIC RANK
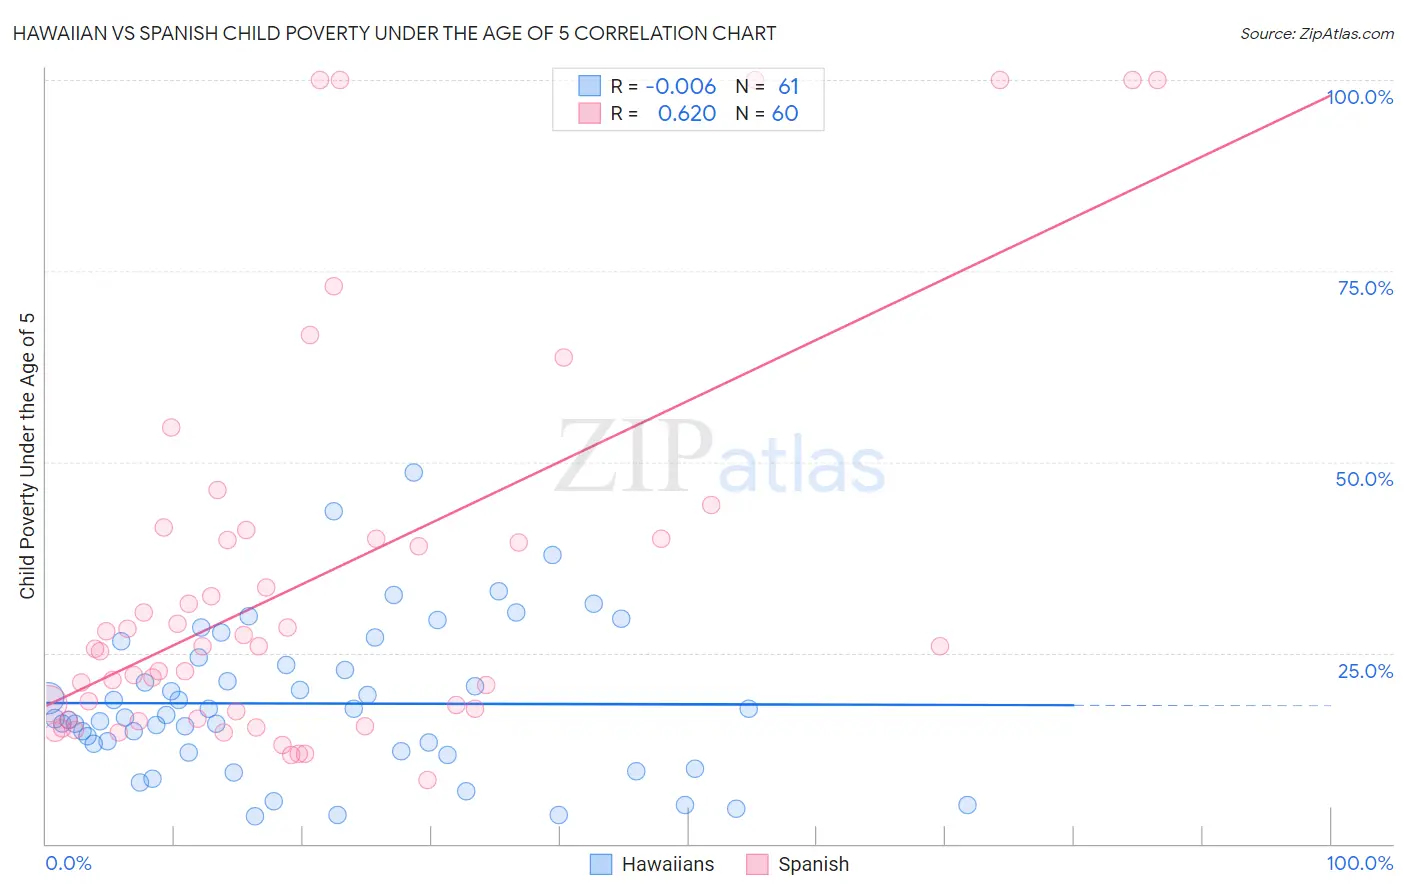
Hawaiian vs Spanish Child Poverty Under the Age of 5 Correlation Chart
The statistical analysis conducted on geographies consisting of 319,559,583 people shows no correlation between the proportion of Hawaiians and poverty level among children under the age of 5 in the United States with a correlation coefficient (R) of -0.006 and weighted average of 17.4%. Similarly, the statistical analysis conducted on geographies consisting of 404,966,909 people shows a significant positive correlation between the proportion of Spanish and poverty level among children under the age of 5 in the United States with a correlation coefficient (R) of 0.620 and weighted average of 18.2%, a difference of 4.8%.
Child Poverty Under the Age of 5 Correlation Summary
| Measurement | Hawaiian | Spanish |
| Minimum | 3.6% | 8.4% |
| Maximum | 48.5% | 100.0% |
| Range | 44.9% | 91.6% |
| Mean | 18.4% | 34.6% |
| Median | 16.6% | 25.9% |
| Interquartile 25% (IQ1) | 12.0% | 16.9% |
| Interquartile 75% (IQ3) | 23.9% | 40.0% |
| Interquartile Range (IQR) | 11.9% | 23.1% |
| Standard Deviation (Sample) | 9.7% | 25.9% |
| Standard Deviation (Population) | 9.7% | 25.6% |
Similar Demographics by Child Poverty Under the Age of 5
Demographics Similar to Hawaiians by Child Poverty Under the Age of 5
In terms of child poverty under the age of 5, the demographic groups most similar to Hawaiians are South American Indian (17.4%, a difference of 0.010%), Immigrants from Germany (17.4%, a difference of 0.050%), Arab (17.4%, a difference of 0.080%), Lebanese (17.4%, a difference of 0.12%), and Immigrants from Cameroon (17.4%, a difference of 0.13%).
| Demographics | Rating | Rank | Child Poverty Under the Age of 5 |
| Yugoslavians | 54.1 /100 | #172 | Average 17.2% |
| Welsh | 54.0 /100 | #173 | Average 17.2% |
| Immigrants | Saudi Arabia | 50.0 /100 | #174 | Average 17.2% |
| Immigrants | Lebanon | 47.6 /100 | #175 | Average 17.3% |
| Immigrants | Iraq | 45.2 /100 | #176 | Average 17.3% |
| Immigrants | Sierra Leone | 43.6 /100 | #177 | Average 17.3% |
| Immigrants | Cameroon | 42.7 /100 | #178 | Average 17.4% |
| Hawaiians | 41.5 /100 | #179 | Average 17.4% |
| South American Indians | 41.4 /100 | #180 | Average 17.4% |
| Immigrants | Germany | 41.0 /100 | #181 | Average 17.4% |
| Arabs | 40.7 /100 | #182 | Average 17.4% |
| Lebanese | 40.3 /100 | #183 | Average 17.4% |
| Immigrants | Costa Rica | 39.0 /100 | #184 | Fair 17.4% |
| Immigrants | Armenia | 38.0 /100 | #185 | Fair 17.5% |
| Immigrants | Bosnia and Herzegovina | 35.0 /100 | #186 | Fair 17.5% |
Demographics Similar to Spanish by Child Poverty Under the Age of 5
In terms of child poverty under the age of 5, the demographic groups most similar to Spanish are Scotch-Irish (18.2%, a difference of 0.010%), Panamanian (18.2%, a difference of 0.010%), Immigrants (18.2%, a difference of 0.020%), Moroccan (18.2%, a difference of 0.10%), and Nepalese (18.3%, a difference of 0.31%).
| Demographics | Rating | Rank | Child Poverty Under the Age of 5 |
| Japanese | 13.8 /100 | #202 | Poor 18.1% |
| Immigrants | Cambodia | 13.7 /100 | #203 | Poor 18.1% |
| Immigrants | Eastern Africa | 13.4 /100 | #204 | Poor 18.1% |
| Spaniards | 12.8 /100 | #205 | Poor 18.1% |
| Whites/Caucasians | 12.6 /100 | #206 | Poor 18.1% |
| Immigrants | Immigrants | 9.9 /100 | #207 | Tragic 18.2% |
| Scotch-Irish | 9.8 /100 | #208 | Tragic 18.2% |
| Spanish | 9.8 /100 | #209 | Tragic 18.2% |
| Panamanians | 9.7 /100 | #210 | Tragic 18.2% |
| Moroccans | 9.4 /100 | #211 | Tragic 18.2% |
| Nepalese | 8.7 /100 | #212 | Tragic 18.3% |
| Immigrants | Thailand | 8.6 /100 | #213 | Tragic 18.3% |
| Malaysians | 6.5 /100 | #214 | Tragic 18.4% |
| Immigrants | Panama | 6.0 /100 | #215 | Tragic 18.5% |
| Hmong | 5.0 /100 | #216 | Tragic 18.5% |