Hawaiian vs Native Hawaiian Child Poverty Under the Age of 5
COMPARE
Hawaiian
Native Hawaiian
Child Poverty Under the Age of 5
Child Poverty Under the Age of 5 Comparison
Hawaiians
Native Hawaiians
17.4%
CHILD POVERTY UNDER THE AGE OF 5
41.5/ 100
METRIC RATING
179th/ 347
METRIC RANK
16.2%
CHILD POVERTY UNDER THE AGE OF 5
91.8/ 100
METRIC RATING
125th/ 347
METRIC RANK
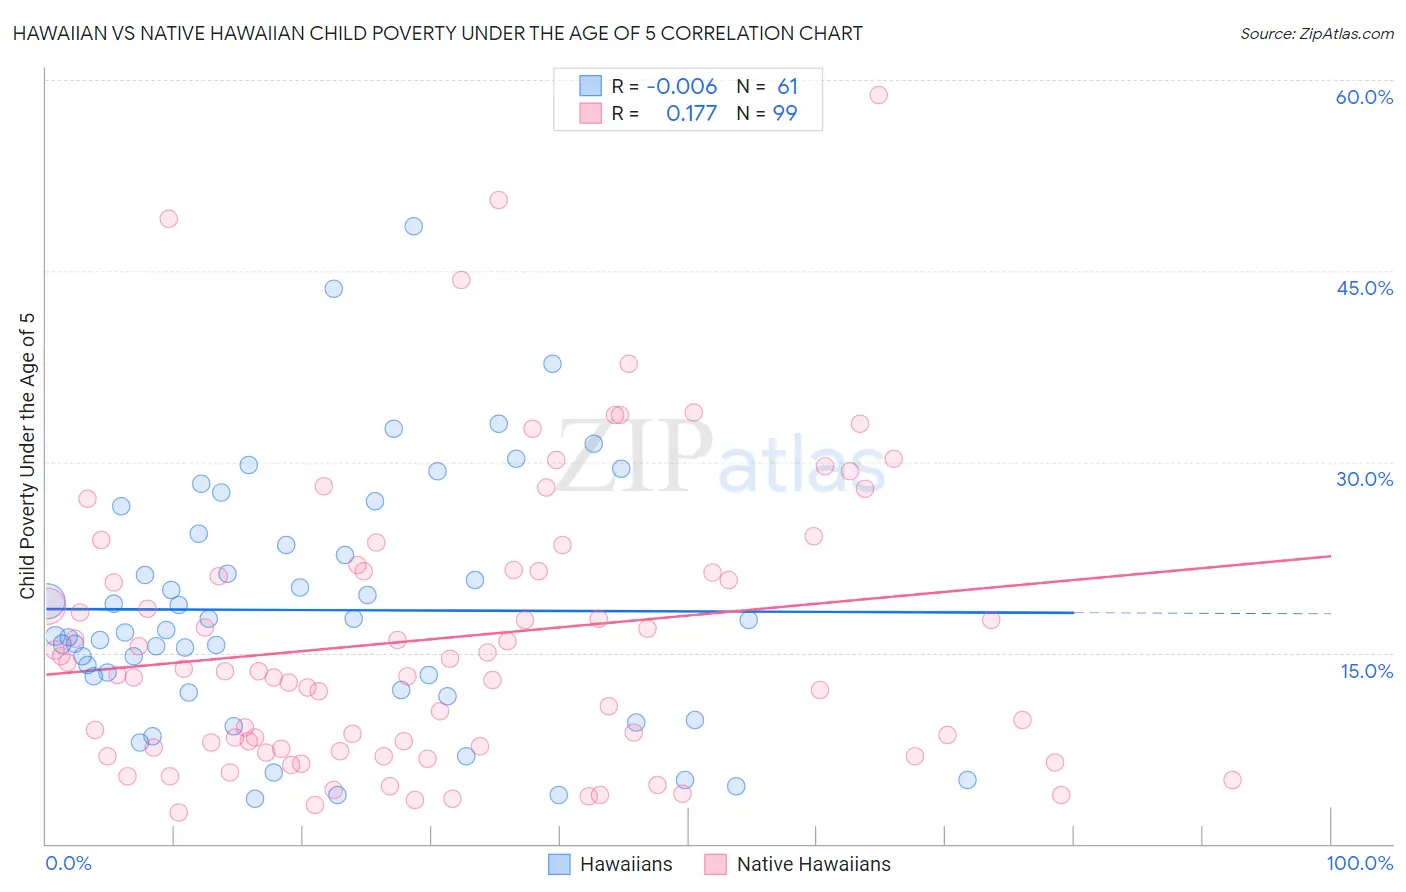
Hawaiian vs Native Hawaiian Child Poverty Under the Age of 5 Correlation Chart
The statistical analysis conducted on geographies consisting of 319,559,583 people shows no correlation between the proportion of Hawaiians and poverty level among children under the age of 5 in the United States with a correlation coefficient (R) of -0.006 and weighted average of 17.4%. Similarly, the statistical analysis conducted on geographies consisting of 323,152,225 people shows a poor positive correlation between the proportion of Native Hawaiians and poverty level among children under the age of 5 in the United States with a correlation coefficient (R) of 0.177 and weighted average of 16.2%, a difference of 7.6%.
Child Poverty Under the Age of 5 Correlation Summary
| Measurement | Hawaiian | Native Hawaiian |
| Minimum | 3.6% | 2.4% |
| Maximum | 48.5% | 58.8% |
| Range | 44.9% | 56.4% |
| Mean | 18.4% | 16.1% |
| Median | 16.6% | 13.5% |
| Interquartile 25% (IQ1) | 12.0% | 7.5% |
| Interquartile 75% (IQ3) | 23.9% | 21.4% |
| Interquartile Range (IQR) | 11.9% | 13.9% |
| Standard Deviation (Sample) | 9.7% | 11.3% |
| Standard Deviation (Population) | 9.7% | 11.3% |
Similar Demographics by Child Poverty Under the Age of 5
Demographics Similar to Hawaiians by Child Poverty Under the Age of 5
In terms of child poverty under the age of 5, the demographic groups most similar to Hawaiians are South American Indian (17.4%, a difference of 0.010%), Immigrants from Germany (17.4%, a difference of 0.050%), Arab (17.4%, a difference of 0.080%), Lebanese (17.4%, a difference of 0.12%), and Immigrants from Cameroon (17.4%, a difference of 0.13%).
| Demographics | Rating | Rank | Child Poverty Under the Age of 5 |
| Yugoslavians | 54.1 /100 | #172 | Average 17.2% |
| Welsh | 54.0 /100 | #173 | Average 17.2% |
| Immigrants | Saudi Arabia | 50.0 /100 | #174 | Average 17.2% |
| Immigrants | Lebanon | 47.6 /100 | #175 | Average 17.3% |
| Immigrants | Iraq | 45.2 /100 | #176 | Average 17.3% |
| Immigrants | Sierra Leone | 43.6 /100 | #177 | Average 17.3% |
| Immigrants | Cameroon | 42.7 /100 | #178 | Average 17.4% |
| Hawaiians | 41.5 /100 | #179 | Average 17.4% |
| South American Indians | 41.4 /100 | #180 | Average 17.4% |
| Immigrants | Germany | 41.0 /100 | #181 | Average 17.4% |
| Arabs | 40.7 /100 | #182 | Average 17.4% |
| Lebanese | 40.3 /100 | #183 | Average 17.4% |
| Immigrants | Costa Rica | 39.0 /100 | #184 | Fair 17.4% |
| Immigrants | Armenia | 38.0 /100 | #185 | Fair 17.5% |
| Immigrants | Bosnia and Herzegovina | 35.0 /100 | #186 | Fair 17.5% |
Demographics Similar to Native Hawaiians by Child Poverty Under the Age of 5
In terms of child poverty under the age of 5, the demographic groups most similar to Native Hawaiians are Immigrants from Albania (16.2%, a difference of 0.0%), Swiss (16.1%, a difference of 0.070%), Austrian (16.1%, a difference of 0.080%), Immigrants from England (16.2%, a difference of 0.090%), and Immigrants from Southern Europe (16.1%, a difference of 0.10%).
| Demographics | Rating | Rank | Child Poverty Under the Age of 5 |
| Immigrants | Denmark | 93.4 /100 | #118 | Exceptional 16.0% |
| Immigrants | Jordan | 93.2 /100 | #119 | Exceptional 16.1% |
| Immigrants | Peru | 92.6 /100 | #120 | Exceptional 16.1% |
| Mongolians | 92.5 /100 | #121 | Exceptional 16.1% |
| Immigrants | Southern Europe | 92.0 /100 | #122 | Exceptional 16.1% |
| Austrians | 92.0 /100 | #123 | Exceptional 16.1% |
| Swiss | 92.0 /100 | #124 | Exceptional 16.1% |
| Native Hawaiians | 91.8 /100 | #125 | Exceptional 16.2% |
| Immigrants | Albania | 91.8 /100 | #126 | Exceptional 16.2% |
| Immigrants | England | 91.5 /100 | #127 | Exceptional 16.2% |
| South Africans | 90.1 /100 | #128 | Exceptional 16.2% |
| British | 89.4 /100 | #129 | Excellent 16.3% |
| Immigrants | Norway | 89.3 /100 | #130 | Excellent 16.3% |
| Finns | 88.3 /100 | #131 | Excellent 16.3% |
| Serbians | 88.2 /100 | #132 | Excellent 16.3% |