Hawaiian vs Spanish Unemployment Among Seniors over 75 years
COMPARE
Hawaiian
Spanish
Unemployment Among Seniors over 75 years
Unemployment Among Seniors over 75 years Comparison
Hawaiians
Spanish
9.3%
UNEMPLOYMENT AMONG SENIORS OVER 75 YEARS
1.2/ 100
METRIC RATING
257th/ 347
METRIC RANK
9.1%
UNEMPLOYMENT AMONG SENIORS OVER 75 YEARS
3.3/ 100
METRIC RATING
240th/ 347
METRIC RANK
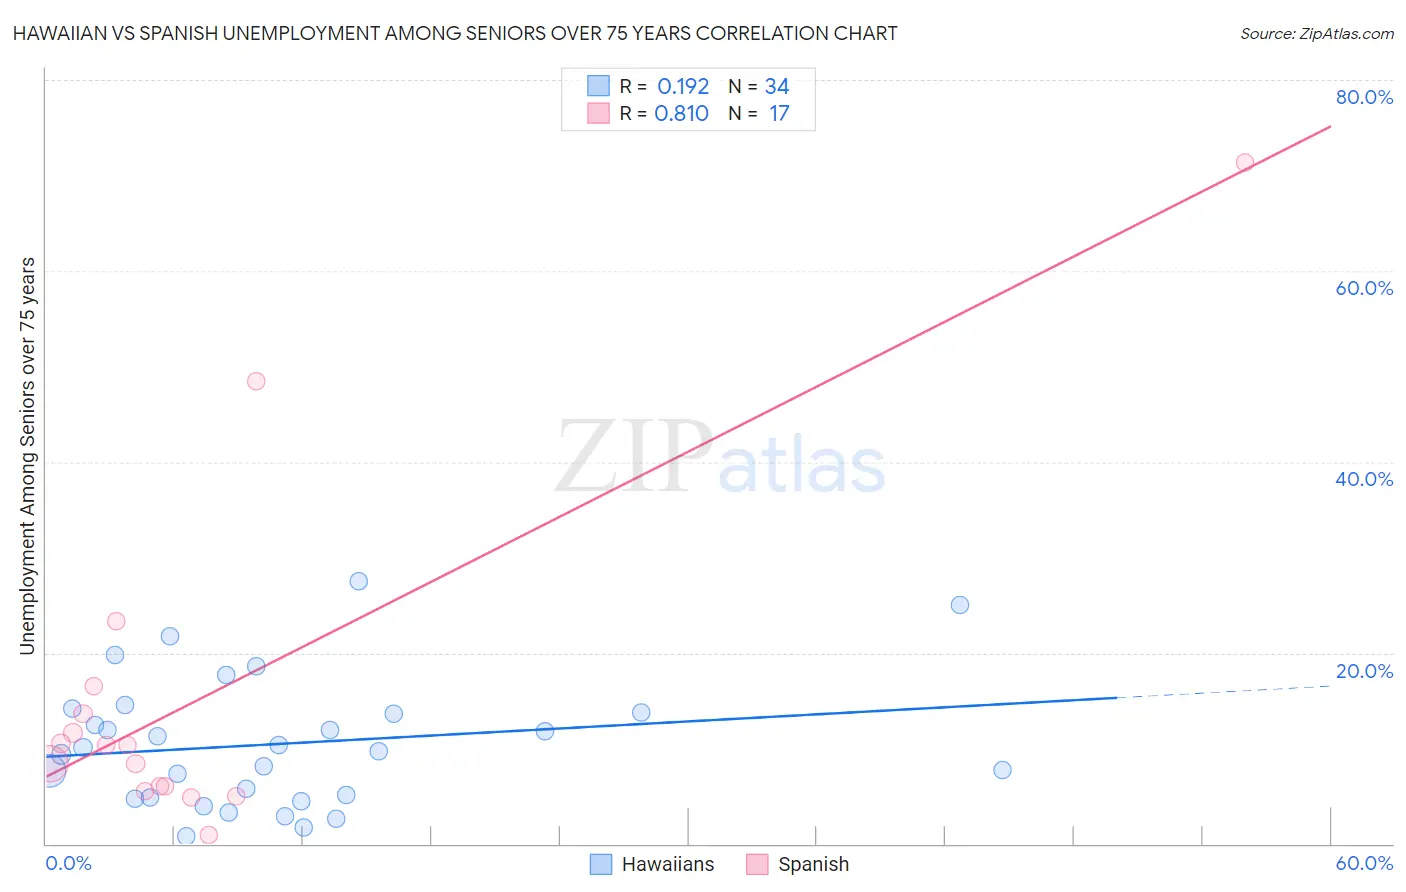
Hawaiian vs Spanish Unemployment Among Seniors over 75 years Correlation Chart
The statistical analysis conducted on geographies consisting of 176,904,656 people shows a poor positive correlation between the proportion of Hawaiians and unemployment rate among seniors over the age of 75 in the United States with a correlation coefficient (R) of 0.192 and weighted average of 9.3%. Similarly, the statistical analysis conducted on geographies consisting of 210,206,021 people shows a very strong positive correlation between the proportion of Spanish and unemployment rate among seniors over the age of 75 in the United States with a correlation coefficient (R) of 0.810 and weighted average of 9.1%, a difference of 1.4%.
Unemployment Among Seniors over 75 years Correlation Summary
| Measurement | Hawaiian | Spanish |
| Minimum | 0.80% | 0.90% |
| Maximum | 27.6% | 71.4% |
| Range | 26.8% | 70.5% |
| Mean | 10.5% | 15.4% |
| Median | 9.9% | 10.3% |
| Interquartile 25% (IQ1) | 4.9% | 5.7% |
| Interquartile 75% (IQ3) | 13.8% | 15.0% |
| Interquartile Range (IQR) | 8.9% | 9.3% |
| Standard Deviation (Sample) | 6.7% | 18.0% |
| Standard Deviation (Population) | 6.6% | 17.5% |
Demographics Similar to Hawaiians and Spanish by Unemployment Among Seniors over 75 years
In terms of unemployment among seniors over 75 years, the demographic groups most similar to Hawaiians are Brazilian (9.3%, a difference of 0.12%), Immigrants from England (9.3%, a difference of 0.14%), Immigrants from Scotland (9.2%, a difference of 0.27%), Immigrants from Ghana (9.2%, a difference of 0.46%), and Pima (9.2%, a difference of 0.55%). Similarly, the demographic groups most similar to Spanish are Mexican (9.1%, a difference of 0.050%), Inupiat (9.1%, a difference of 0.10%), Immigrants from Southern Europe (9.2%, a difference of 0.21%), Sierra Leonean (9.2%, a difference of 0.23%), and Slavic (9.2%, a difference of 0.24%).
| Demographics | Rating | Rank | Unemployment Among Seniors over 75 years |
| Inupiat | 3.6 /100 | #238 | Tragic 9.1% |
| Mexicans | 3.5 /100 | #239 | Tragic 9.1% |
| Spanish | 3.3 /100 | #240 | Tragic 9.1% |
| Immigrants | Southern Europe | 2.8 /100 | #241 | Tragic 9.2% |
| Sierra Leoneans | 2.8 /100 | #242 | Tragic 9.2% |
| Slavs | 2.8 /100 | #243 | Tragic 9.2% |
| Immigrants | Germany | 2.7 /100 | #244 | Tragic 9.2% |
| Immigrants | Canada | 2.6 /100 | #245 | Tragic 9.2% |
| Immigrants | North America | 2.4 /100 | #246 | Tragic 9.2% |
| Sub-Saharan Africans | 2.3 /100 | #247 | Tragic 9.2% |
| Blackfeet | 2.3 /100 | #248 | Tragic 9.2% |
| Immigrants | Saudi Arabia | 2.2 /100 | #249 | Tragic 9.2% |
| Central American Indians | 2.2 /100 | #250 | Tragic 9.2% |
| Immigrants | Poland | 2.0 /100 | #251 | Tragic 9.2% |
| Immigrants | Sudan | 2.0 /100 | #252 | Tragic 9.2% |
| Pima | 1.8 /100 | #253 | Tragic 9.2% |
| Immigrants | Ghana | 1.7 /100 | #254 | Tragic 9.2% |
| Immigrants | Scotland | 1.4 /100 | #255 | Tragic 9.2% |
| Brazilians | 1.3 /100 | #256 | Tragic 9.3% |
| Hawaiians | 1.2 /100 | #257 | Tragic 9.3% |
| Immigrants | England | 1.0 /100 | #258 | Tragic 9.3% |