Guyanese vs Osage Single Female Poverty

COMPARE

Guyanese
Race
Ancestry
AfghanAfricanAlaska NativeAlaskan AthabascanAlbanianAleutAlsatianAmericanApacheArabArapahoArgentineanArmenianAssyrian/Chaldean/SyriacAustralianAustrianBahamianBangladeshiBarbadianBasqueBelgianBelizeanBermudanBhutaneseBlackfeetBolivianBrazilianBritishBritish West IndianBulgarianBurmeseCajunCambodianCanadianCape VerdeanCarpatho RusynCelticCentral AmericanCentral American IndianCherokeeCheyenneChickasawChileanChineseChippewaChoctawColombianColvilleComancheCosta RicanCreeCreekCroatianCrowCubanCypriotCzechCzechoslovakianDanishDelawareDominicanDutchDutch West IndianEastern EuropeanEcuadorianEgyptianEnglishEstonianEthiopianEuropeanFijianFilipinoFinnishFrenchFrench American IndianFrench CanadianGermanGerman RussianGhanaianGreekGuamanian/ChamorroGuatemalanGuyaneseHaitianHmongHonduranHopiHoumaHungarianIcelanderIndian (Asian)IndonesianInupiatIranianIraqiIrishIroquoisIsraeliItalianJamaicanJapaneseJordanianKenyanKiowaKoreanLaotianLatvianLebaneseLiberianLithuanianLumbeeLuxembourgerMacedonianMalaysianMalteseMarshalleseMenomineeMexicanMexican American IndianMongolianMoroccanNative HawaiianNavajoNepaleseNew ZealanderNicaraguanNigerianNorthern EuropeanNorwegianOkinawanOttawaPaiutePakistaniPalestinianPanamanianParaguayanPennsylvania GermanPeruvianPimaPolishPortuguesePotawatomiPuebloPuerto RicanPuget Sound SalishRomanianRussianSalvadoranSamoanScandinavianScotch-IrishScottishSeminoleSenegaleseSerbianShoshoneSierra LeoneanSiouxSlavicSlovakSloveneSomaliSouth AfricanSouth AmericanSouth American IndianSoviet UnionSpaniardSpanishSpanish AmericanSpanish American IndianSri LankanSubsaharan AfricanSudaneseSwedishSwissSyrianTaiwaneseThaiTlingit-HaidaTohono O'OdhamTonganTrinidadian and TobagonianTsimshianTurkishU.S. Virgin IslanderUgandanUkrainianUruguayanUteVenezuelanVietnameseWelshWest IndianYakamaYaquiYugoslavianYumanYup'ikZimbabwean
Immigration
NonimmigrantsImmigrantsAfghanistanAfricaAlbaniaArgentinaArmeniaAsiaAustraliaAustriaBahamasBangladeshBarbadosBelarusBelgiumBelizeBoliviaBosnia and HerzegovinaBrazilBulgariaBurma/MyanmarCabo VerdeCambodiaCameroonCanadaCaribbeanCentral AmericaChileChinaColombiaCongoCosta RicaCroatiaCubaCzechoslovakiaDenmarkDominicaDominican RepublicEastern AfricaEastern AsiaEastern EuropeEcuadorEgyptEl SalvadorEnglandEritreaEthiopiaEuropeFijiFranceGermanyGhanaGreeceGrenadaGuatemalaGuyanaHaitiHondurasHong KongHungaryIndiaIndonesiaIranIraqIrelandIsraelItalyJamaicaJapanJordanKazakhstanKenyaKoreaKuwaitLaosLatin AmericaLatviaLebanonLiberiaLithuaniaMalaysiaMexicoMicronesiaMiddle AfricaMoldovaMoroccoNepalNetherlandsNicaraguaNigeriaNorth AmericaNorth MacedoniaNorthern AfricaNorthern EuropeNorwayOceaniaPakistanPanamaPeruPhilippinesPolandPortugalRomaniaRussiaSaudi ArabiaScotlandSenegalSerbiaSierra LeoneSingaporeSomaliaSouth AfricaSouth AmericaSouth Central AsiaSouth Eastern AsiaSouthern EuropeSpainSri LankaSt. Vincent and the GrenadinesSudanSwedenSwitzerlandSyriaTaiwanThailandTrinidad and TobagoTurkeyUgandaUkraineUruguayUzbekistanVenezuelaVietnamWest IndiesWestern AfricaWestern AsiaWestern EuropeYemenZaireZimbabweAzores
Osage
Race
Ancestry
AfghanAfricanAlaska NativeAlaskan AthabascanAlbanianAleutAlsatianAmericanApacheArabArapahoArgentineanArmenianAssyrian/Chaldean/SyriacAustralianAustrianBahamianBangladeshiBarbadianBasqueBelgianBelizeanBermudanBhutaneseBlackfeetBolivianBrazilianBritishBritish West IndianBulgarianBurmeseCajunCambodianCanadianCape VerdeanCarpatho RusynCelticCentral AmericanCentral American IndianCherokeeCheyenneChickasawChileanChineseChippewaChoctawColombianColvilleComancheCosta RicanCreeCreekCroatianCrowCubanCypriotCzechCzechoslovakianDanishDelawareDominicanDutchDutch West IndianEastern EuropeanEcuadorianEgyptianEnglishEstonianEthiopianEuropeanFijianFilipinoFinnishFrenchFrench American IndianFrench CanadianGermanGerman RussianGhanaianGreekGuamanian/ChamorroGuatemalanHaitianHmongHonduranHopiHoumaHungarianIcelanderIndian (Asian)IndonesianInupiatIranianIraqiIrishIroquoisIsraeliItalianJamaicanJapaneseJordanianKenyanKiowaKoreanLaotianLatvianLebaneseLiberianLithuanianLumbeeLuxembourgerMacedonianMalaysianMalteseMarshalleseMenomineeMexicanMexican American IndianMongolianMoroccanNative HawaiianNavajoNepaleseNew ZealanderNicaraguanNigerianNorthern EuropeanNorwegianOkinawanOsageOttawaPaiutePakistaniPalestinianPanamanianParaguayanPennsylvania GermanPeruvianPimaPolishPortuguesePotawatomiPuebloPuerto RicanPuget Sound SalishRomanianRussianSalvadoranSamoanScandinavianScotch-IrishScottishSeminoleSenegaleseSerbianShoshoneSierra LeoneanSiouxSlavicSlovakSloveneSomaliSouth AfricanSouth AmericanSouth American IndianSoviet UnionSpaniardSpanishSpanish AmericanSpanish American IndianSri LankanSubsaharan AfricanSudaneseSwedishSwissSyrianTaiwaneseThaiTlingit-HaidaTohono O'OdhamTonganTrinidadian and TobagonianTsimshianTurkishU.S. Virgin IslanderUgandanUkrainianUruguayanUteVenezuelanVietnameseWelshWest IndianYakamaYaquiYugoslavianYumanYup'ikZimbabwean
Immigration
NonimmigrantsImmigrantsAfghanistanAfricaAlbaniaArgentinaArmeniaAsiaAustraliaAustriaBahamasBangladeshBarbadosBelarusBelgiumBelizeBoliviaBosnia and HerzegovinaBrazilBulgariaBurma/MyanmarCabo VerdeCambodiaCameroonCanadaCaribbeanCentral AmericaChileChinaColombiaCongoCosta RicaCroatiaCubaCzechoslovakiaDenmarkDominicaDominican RepublicEastern AfricaEastern AsiaEastern EuropeEcuadorEgyptEl SalvadorEnglandEritreaEthiopiaEuropeFijiFranceGermanyGhanaGreeceGrenadaGuatemalaGuyanaHaitiHondurasHong KongHungaryIndiaIndonesiaIranIraqIrelandIsraelItalyJamaicaJapanJordanKazakhstanKenyaKoreaKuwaitLaosLatin AmericaLatviaLebanonLiberiaLithuaniaMalaysiaMexicoMicronesiaMiddle AfricaMoldovaMoroccoNepalNetherlandsNicaraguaNigeriaNorth AmericaNorth MacedoniaNorthern AfricaNorthern EuropeNorwayOceaniaPakistanPanamaPeruPhilippinesPolandPortugalRomaniaRussiaSaudi ArabiaScotlandSenegalSerbiaSierra LeoneSingaporeSomaliaSouth AfricaSouth AmericaSouth Central AsiaSouth Eastern AsiaSouthern EuropeSpainSri LankaSt. Vincent and the GrenadinesSudanSwedenSwitzerlandSyriaTaiwanThailandTrinidad and TobagoTurkeyUgandaUkraineUruguayUzbekistanVenezuelaVietnamWest IndiesWestern AfricaWestern AsiaWestern EuropeYemenZaireZimbabweAzores
Single Female Poverty
Income
Poverty
Unemployment
Labor Participation
Family Structure
Vehicle Availability
Education Level
Disability

Single Female Poverty Comparison

Guyanese

Osage

Average
Tragic
21.0%
SINGLE FEMALE POVERTY
52.0/ 100
METRIC RATING
172nd/ 347
METRIC RANK
24.4%
SINGLE FEMALE POVERTY
0.0/ 100
METRIC RATING
291st/ 347
METRIC RANK

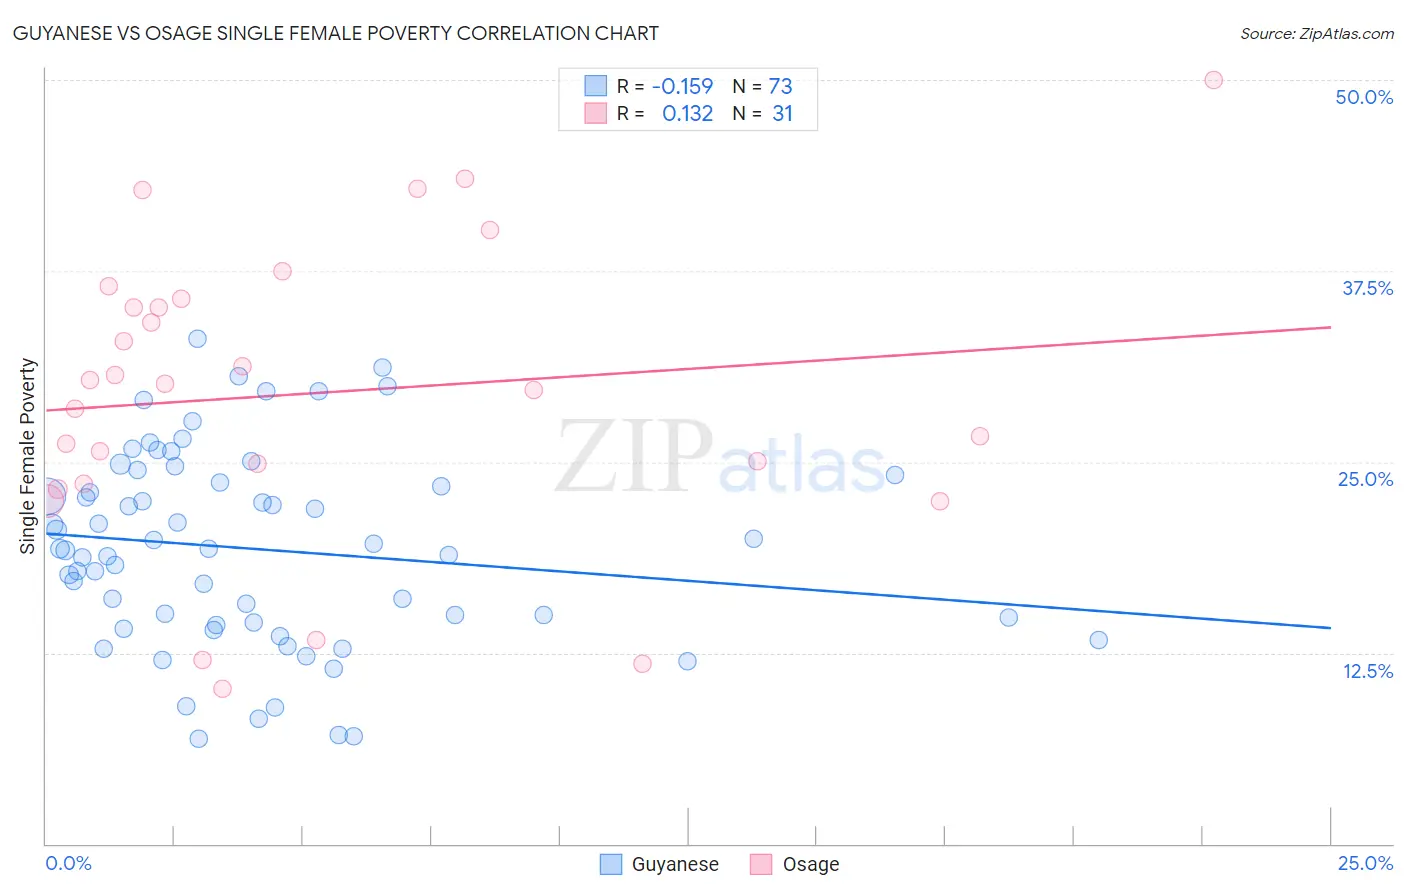
Guyanese vs Osage Single Female Poverty Correlation Chart

The statistical analysis conducted on geographies consisting of 175,255,160 people shows a poor negative correlation between the proportion of Guyanese and poverty level among single females in the United States with a correlation coefficient (R) of -0.159 and weighted average of 21.0%. Similarly, the statistical analysis conducted on geographies consisting of 91,495,293 people shows a poor positive correlation between the proportion of Osage and poverty level among single females in the United States with a correlation coefficient (R) of 0.132 and weighted average of 24.4%, a difference of 16.3%.
Guyanese vs Osage Single Female Poverty

Single Female Poverty Correlation Summary

MeasurementGuyaneseOsage
Minimum6.8%10.2%
Maximum33.1%50.0%
Range26.2%39.8%
Mean19.3%29.5%
Median19.3%30.1%
Interquartile 25% (IQ1)14.4%23.6%
Interquartile 75% (IQ3)23.9%35.7%
Interquartile Range (IQR)9.5%12.1%
Standard Deviation (Sample)6.3%9.7%
Standard Deviation (Population)6.3%9.6%

Similar Demographics by Single Female Poverty

Demographics Similar to Guyanese by Single Female Poverty

In terms of single female poverty, the demographic groups most similar to Guyanese are Moroccan (21.0%, a difference of 0.050%), New Zealander (21.0%, a difference of 0.070%), Immigrants from Guyana (21.0%, a difference of 0.090%), Cuban (21.0%, a difference of 0.13%), and Immigrants from Trinidad and Tobago (20.9%, a difference of 0.27%).
DemographicsRating | RankSingle Female Poverty
Ugandans
64.0
/100
|
#165
Good
20.8%
Norwegians
63.0
/100
|
#166
Good
20.8%
Immigrants | Norway
63.0
/100
|
#167
Good
20.8%
Immigrants | Costa Rica
61.5
/100
|
#168
Good
20.9%
Immigrants | Trinidad and Tobago
56.3
/100
|
#169
Average
20.9%
New Zealanders
53.2
/100
|
#170
Average
21.0%
Moroccans
52.8
/100
|
#171
Average
21.0%
Guyanese
52.0
/100
|
#172
Average
21.0%
Immigrants | Guyana
50.6
/100
|
#173
Average
21.0%
Cubans
50.0
/100
|
#174
Average
21.0%
Czechs
46.8
/100
|
#175
Average
21.0%
Canadians
45.4
/100
|
#176
Average
21.1%
Scandinavians
45.2
/100
|
#177
Average
21.1%
Immigrants | Bosnia and Herzegovina
44.9
/100
|
#178
Average
21.1%
British
42.9
/100
|
#179
Average
21.1%

Demographics Similar to Osage by Single Female Poverty

In terms of single female poverty, the demographic groups most similar to Osage are Alsatian (24.5%, a difference of 0.37%), American (24.5%, a difference of 0.44%), French American Indian (24.6%, a difference of 0.59%), Indonesian (24.3%, a difference of 0.60%), and U.S. Virgin Islander (24.2%, a difference of 0.94%).
DemographicsRating | RankSingle Female Poverty
Immigrants | Dominica
0.0
/100
|
#284
Tragic
23.9%
Immigrants | Guatemala
0.0
/100
|
#285
Tragic
24.1%
Cree
0.0
/100
|
#286
Tragic
24.1%
Bangladeshis
0.0
/100
|
#287
Tragic
24.2%
Spanish Americans
0.0
/100
|
#288
Tragic
24.2%
U.S. Virgin Islanders
0.0
/100
|
#289
Tragic
24.2%
Indonesians
0.0
/100
|
#290
Tragic
24.3%
Osage
0.0
/100
|
#291
Tragic
24.4%
Alsatians
0.0
/100
|
#292
Tragic
24.5%
Americans
0.0
/100
|
#293
Tragic
24.5%
French American Indians
0.0
/100
|
#294
Tragic
24.6%
Hispanics or Latinos
0.0
/100
|
#295
Tragic
24.6%
Africans
0.0
/100
|
#296
Tragic
24.8%
Immigrants | Central America
0.0
/100
|
#297
Tragic
24.8%
Yaqui
0.0
/100
|
#298
Tragic
24.9%